
Advertisement
Advertisement
Technical Outlook – NZDUSD, USDCAD and USDJPY
By:
NZDUSD Short-term descending trend-channel keep favoring the NZDUSD decline that is currently testing the immediate ascending trend-line support, near
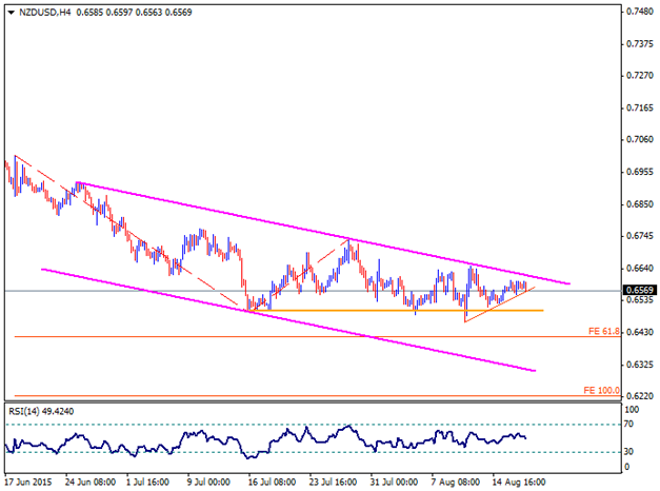
NZDUSD
Short-term descending trend-channel keep favoring the NZDUSD decline that is currently testing the immediate ascending trend-line support, near 0.6560, breaking which 0.6510 – 0.6500 horizontal mark is likely intermediate support prior to the pair’s plunge to 61.8% FE of its June-July decline near 0.6415. Moreover, an extended south-move below 0.6410, also surpassing 0.6400 mark, seems to be restricted by the channel support, at 0.6300 round figure mark. On the upside, a break of 0.6615-20 channel resistance, could trigger the pair’s immediate rally towards 0.6740-50 resistance area, breaking which the pair can extend its upward trajectory to 0.6810 and 0.6880 levels. Given the pair’s ability to surpass 0.6880, it can stretch its upward trajectory towards 0.7000 psychological magnet.
USDCAD
Ever since the pair broke above its 1.2810-30 horizontal mark, including January and March highs together with the 50-day EMA, short-term ascending trend-channel kept supporting the USDCAD up-move. However, the pair failed to break the 1.3200 mark and formed a descending trend-line, connecting recent highs, that forced it to test the channel support, currently near 1.3000 psychological mark. Should it break the said channel support, it can quickly witness a pullback towards 1.2810-30 re-test, breaking which the pair becomes vulnerable to plunge towards 1.2560-50 support area. Alternatively, a reversal from the current level can find the trend-line resistance, near 1.3140, as immediate cap to its up-move while a break of which could fuel the pair to 1.3200 – 1.3210 resistance-zone prior to targeting the channel resistance, near 1.3300 mark. Given the pair’s ability to keep its rally intact above 1.3300, it could be well in the position to test 100% FE of its November 2014 to March 2015 up-move, near 1.3570.
USDJPY
Even if the USDJPY failed to break the 125.00 – 125.10 horizontal mark on a closing basis, immediate ascending trend-channel favors the pair’s near-term up-move; however, the pair currently trades near the channel support, 123.80, breaking which it can quickly test 123.50, 23.6% Fibo of its January – June up-move before targeting 122.50 and the 122.00 – 121.80 important horizontal support. If it sustains the break of 121.80, the pair becomes vulnerable to plunge towards 120.00 mark with 120.80 being intermediate support. Meanwhile, the 124.60, quickly followed by the 125.00 – 125.10 horizontal mark, are likely immediate resistances for the pair prior to its move to June highs of 125.85 that also encompasses the upper line of channel. On a further up-move beyond 125.85 can witness 61.8% FE of the said move, near 126.60 as consecutive resistance.
Follow me on twitter to discuss latest markets events @Fx_Anil
About the Author
Anil Panchalauthor
An MBA (Finance) degree holder with more than five years of experience in tracking the global Forex market. His expertise lies in fundamental analysis but he does not give up on technical aspects in order to identify profitable trade opportunities.


Advertisement