Advertisement
Advertisement
Technical Overview For EUR/JPY, NZD/JPY & CAD/JPY
By:
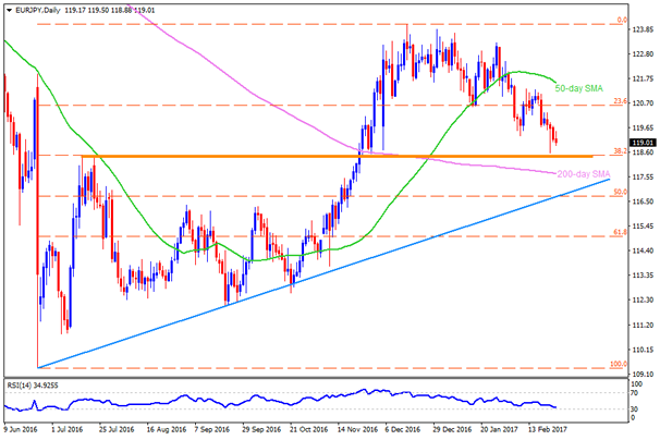
EUR/JPY Having failed to justify its bounce from 118.40-60 horizontal-support-line, the EURJPY again aims to revisit the same support-zone, breaking which
EUR/JPY
Having failed to justify its bounce from 118.40-60 horizontal-support-line, the EURJPY again aims to revisit the same support-zone, breaking which 200-day SMA level of 117.70 and 117.20 can quickly be flashed on the chart. However, pair’s further downside below 117.20 can be confined by 116.70-65 support-confluence, comprising upward slanting trend-line and 50% Fibonacci Retracement of its June-December advances. In case if the quote drops further below 116.65 on a daily closing basis, it becomes weaker enough to test 116.30 & 115.50 support-marks. On the upside, 119.55 and 120.20 may entertain the pair’s short-term pullbacks before offering 120.60 resistance to traders. Should the pair successfully clear 120.60, the 121.00, 121.30 & 50-day SMA figure of 121.55 are likely consecutive north-side numbers to appear.
NZD/JPY
NZDJPY is presently witnessing downside pressure to test 81.00 round figure before challenging an upward slanting trend-line support at 80.80, breaking which 80.60 and 80.40 might please sellers. If bears dominate momentum after breaking 80.40, the 80.00 round figure can offer an intermediate halt during the pair’s southward trajectory towards 79.70 & 79.00 support-levels. Given the pair takes a U-turn from present levels, the 81.30 and an immediate descending trend-line, at 81.55, may keep restricting its near-term advances, breaking which 81.80 & another trend-line resistance, at 82.00, becomes important to watch. In case the quote manage to extend its recovery beyond 82.00, the 82.55 & 82.75 can be good to expect.
CAD/JPY
CADJPY is another example of the JPY pair which signal downside. The pair indicates 85.50 as quick support before giving importance to 84.75-80 horizontal-line. However, pair’s sustained break of 84.75 opens the door for its drop to 100-day SMA figure of 84.00 and then to 83.30 support-mark. Meanwhile, 86.10 and 86.60 are expected immediate resistances for traders to observe before looking at the 50-day SMA figure of 86.80 while the pair’s additional up-move above 86.80 can be confined by more than two-month old descending trend-line, at 87.40. If at all the quote manage to clear 87.40, it becomes capable enough to aim for 88.00 and the 88.45-50 resistances.
Cheers and Safe Trading,
Anil Panchal
About the Author
Anil Panchalauthor
An MBA (Finance) degree holder with more than five years of experience in tracking the global Forex market. His expertise lies in fundamental analysis but he does not give up on technical aspects in order to identify profitable trade opportunities.
Advertisement
