EURUSD Although the pair managed to rebound from an important support near 1.0800 mark, it still remains within a short-term established downtrend as
EURUSD
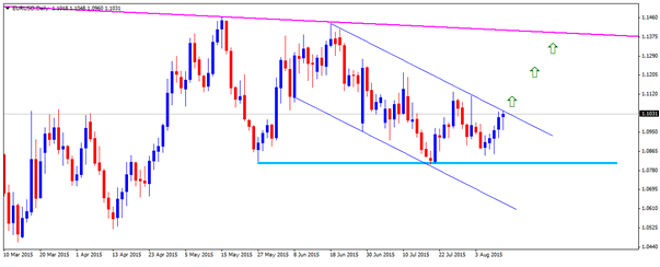
Although the pair managed to rebound from an important support near 1.0800 mark, it still remains within a short-term established downtrend as depicted by formation of a descending trend-channel. The pair is currently trading near 1.1030-40 area, close to the upper trend-line resistance of the channel. A decisive strength above this immediate resistance now seems to open room for extension of the near-term recovery move towards testing its next major resistance near 1.1400 level, marking a descending trend-line resistance extending from Feb. 2015 high through highs tested in May and June. Meanwhile, reversal from current resistance zone now seems to find immediate support near 1.0980 level, which is closely followed by support near 1.0930-25 zone. Reversal from trend-channel resistance and a subsequent drop below immediate support levels now seems to drag the pair back towards testing the very important horizontal support near 1.0800 mark. Moreover, a decisive weakness below 1.0800 mark would now set the stage for resumption of the downward trajectory towards testing sub-1.0700 level, marking the lower trend-line support of the channel currently near 1.0650-40 area.
GBPUSD
After once again failing to conquer 1.5660-80 strong horizontal resistance, the pair dropped to test but hold the lower trend-line support of a short-term ascending trend-channel formation on daily chart. Moreover, now it has been nearly 1-month that the pair has oscillating within a broad trading range between 1.5670-80 resistance and 1.5450 support. The near-term range-bound movement suggests consolidation before attempting a big move on either side and hence the pair’s near-term direction would be determined only once it breaks-out of the trading range. Should the pair decisively weaken below 1.5450 support, marking a break below the ascending trend-channel, and subsequently drop below 200-day SMA support, currently near 1.5380 region, it might accelerate the near-term weakness immediately towards testing sub-1.5200 mark, representing 23.6% Fib. retracement level of its big downfall from July 2014 highs to a multi-year low tested in April 2015. The drop could further get extended towards testing the very important psychological mark support near 1.5000 level. Alternatively, should the pair manage to sustain its strength above 1.5660-80 strong horizontal resistance, it seems to immediately dart towards 1.5770-80 intermediate resistance and eventually aim towards testing 50% Fib. retracement level resistance near 1.5880-1.5990 zone.
USDJPY
The pair’s near-term upward trajectory, as depicted by a short-term ascending trend-channel formation on 1-hourly chart, seems to face serious headwind near 125.00 mark. Hence, a break through 125.00 mark resistance has the potential to lift the pair immediately towards testing the upper trend-line resistance of the ascending channel, currently near 125.65-85 area, also coinciding with multi-year high level touched in early June this year. Moreover, a sustained strength above 125.65-85 resistance area, marking a break-out of the ascending channel has the potential to further accelerate the up-move towards its next major resistance near 127.00 mark, level not seen after May 2002. Meanwhile, failure to conquer 125.00 mark resistance and a subsequent drop back below 124.70-65 support might drag the pair back towards testing the lower trend-line support of the channel, currently near 124.40-30 area. Further, a clear break below the lower trend-line support of the channel seems to trigger a near-term corrective move back towards 122.50 horizontal support region, which could further get extended towards its next major support near 120.60-50 area.
AUDUSD
The pair started reversing its sharp recovery, led by status-quo RBA monetary policy decision, from an important resistance confluence near 0.7440-50 area, comprising of comprising of 23.6% Fib. retracement level of its May to July downfall and the upper trend-line resistance of the descending channel formation visible on daily chart. From current levels, should the pair continue drifting lower and drop back below 0.7300 mark support it seems to resume its previous weakening trend to possibly drop below its recent lows, and even below 0.7100 round figure mark, towards testing the lower trend-line support of the channel, currently near 0.7050-40 zone. Meanwhile, should the pair manage to hold 0.7300 mark support and start recovering it might continue facing strong resistance at the upper trend-line resistance of the channel, currently near 0.7430-50 area. Only a decisive strength above this strong resistance, marking a break-out from the descending channel, might negate any near-term bearish expectations and sets the stage for extension of the recovery momentum towards its next major resistance near 0.7590-0.7600 area, coinciding with 38.2% Fib. retracement level.
Follow me on twitter @Fx_Haresh for latest market updates