
Advertisement
Advertisement
Technical Overview Of EUR/USD, USD/JPY, NZD/USD & USD/CHF: 20.06.2017
By:
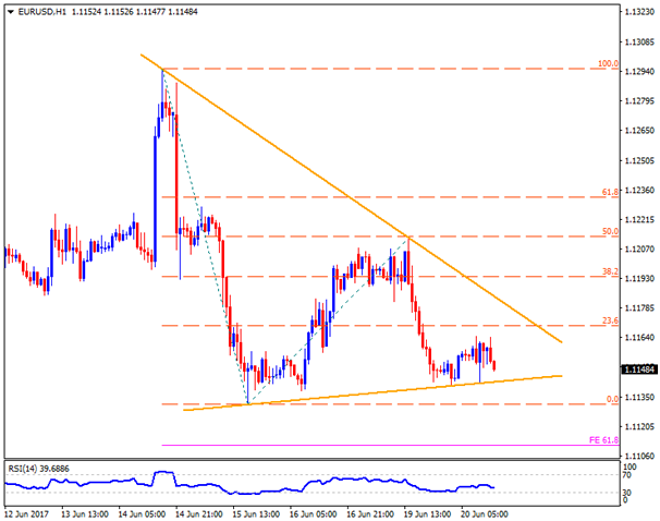
EUR/USD Following its bounce from an immediate trend-line support, at 1.1140 now, the EURUSD might head towards a week-long downward slanting TL, around
EUR/USD
Following its bounce from an immediate trend-line support, at 1.1140 now, the EURUSD might head towards a week-long downward slanting TL, around 1.1180, which could limit the pair’s short-term upside. In case if the quote surpasses 1.1180, it may not respect the 1.1200 round-figure and can aim for 1.1230 resistance-mark, which if broken enable Bulls to target the 1.1260, the 1.1280 and the 1.1300 consecutive numbers to north. On the downside, a clear break of 1.1140 can fetch prices to 1.1130 and then to the 61.8% FE level of 1.1110 before flashing 1.1100 on the chart. Given the pair’s sustained trading below 1.1100, the 1.1080 and the 1.1050 may entertain sellers.
USD/JPY
Even after witnessing pullbacks from 111.80, the USDJPY should not be termed as weak for short-term unless it drops below 110.60 support, break of which can trigger the pair’s south-run to 110.00 and the 109.60. Should prices continue declining after 109.60, the 109.00 and the 108.50 can become intermediate halts during the downturn in direction to April month low near 108.00. Alternatively, 111.80 and the 112.00–112.10 horizontal-line seem nearby important resistances for traders to watch, clearing them could open the door for the pair’s up-move to 113.00, 113.20 and the 113.60. Given the pair’s sustained trading above 113.60, the 114.00 and the 114.40 could be expected as quotes.
NZD/USD
With nearly three-week old ascending trend-line repeatedly restricting NZDUSD’s upside, the pair is likely a strong contestant to claim 0.7290 TL, breaking which current month high around 0.7320 and the 61.8% FE level of 0.7350 can please buyers. During the pair’s additional up-moves after 0.7350, the 0.7380 and the 0.7410 can come-back on the chart. On the downside, break of 0.7220 trend-line support may drag prices to 0.7180 and then to the 0.7165, breaking which 0.7145 and the 0.7100 can be expected as supports. Moreover, the 0.7060 and the 0.7030 may be considered as following rests after the pair’s break of 0.7100 prior to pushing Bears to aim for 0.7000 psychological-magnet.
USD/CHF
A month-old descending trend-line, at 0.9765 now, restricts the USDCHF’s immediate upside and favors a pullback to 0.9700. However, pair’s dip below 0.9700 may find it hard to confront with 0.9650 and the recent low, near 0.9610, break of them may further strengthen the bearish momentum indicating 0.9580 and the 0.9550 as supports. In case if the pair closes above 0.9765, the 0.9805-10 horizontal-line could again try to confine Bulls, clearing which 50-day SMA level of 0.9840 and the 0.9860 should appear as resistances. Given the pair’s successful trading beyond 0.9860, the 0.9900, the 0.9915 and the 100-day SMA level of 0.9935 may act as consecutive resistances to observe.
Cheers and Safe Trading,
Anil Panchal
About the Author
Anil Panchalauthor
An MBA (Finance) degree holder with more than five years of experience in tracking the global Forex market. His expertise lies in fundamental analysis but he does not give up on technical aspects in order to identify profitable trade opportunities.


Advertisement