Advertisement
Advertisement
Technical Update – AUD/CAD, EUR/CAD and CAD/JPY
By:
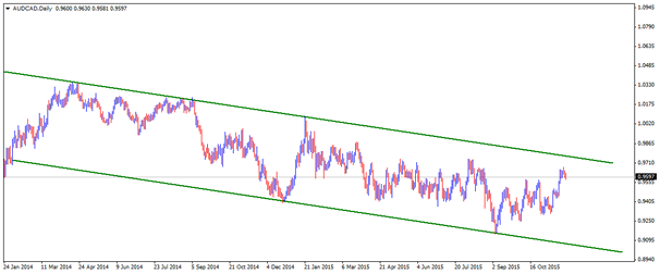
AUD/CAD Although the pair has witnessed some recovery from multi-year low level, tested in Sept., it still remains confined within a well-established
AUD/CAD
EUR/CAD
After confirming a bearish descending triangular formation and a subsequent break below an ascending trend-line support, the pair continued drifting lower and has now dropped to the very important 200-day SMA support near 1.4110-1.4100 area. Extension of the pair’s weakness below 200-day SMA might now find support at 61.8% Fib. retracement level of April to August up-swing, near 1.4000-1.3990 area. Meanwhile, in order to register any meaningful recovery, the pair first needs to clear 1.4150 immediate resistance, which if conquered has the potential to lift the pair back towards retesting 50% Fib. retracement level resistance, near 1.4290-1.4300 region.
CAD/JPY
On 4-hourly chart, the pair seems to have formed a bearish Rising Wedge chart-pattern, and is currently trading close to the lower ascending trend-line support near 91.75-70 area. Should the pair decisively break below 91.75-70 support area, thus confirming the bearish patter, it is likely to drop immediately towards its intermediate support near 91.50 level before heading towards its next major support near 90.60-50 area, marking low tested in late October. Alternatively, should the pair manage to hold and rebound from this immediate support, it is likely to confront immediate resistance near 92.30 horizontal level. Sustained strength above this immediate resistance now seems to pave way for extension of the bounce back towards testing its major resistance near 93.00-93.10 zone.
Follow me on twitter to discuss latest markets updates @Fx_Haresh
About the Author
Haresh Menghaniauthor
Advertisement
