

EURUSD After reversing from a very important resistance near 1.1460-70 area, the pair dropped below 100-day SMA and subsequently on Tuesday broke below
EURUSD

After reversing from a very important resistance near 1.1460-70 area, the pair dropped below 100-day SMA and subsequently on Tuesday broke below 50-day SMA. The pair, however, has managed to find some support near 1.0880 level, marking 61.8% Fib. retracement level of 1.0520 to 1.1467 up-swing. Sustained trade below 1.0880 support seems to accelerate the fall immediately towards 1.0820 support area, which could further get extended below 1.0700 mark towards testing its next important support near 1.0680-60 area. Meanwhile rebound from support level and a subsequent move above 1.0920-25 resistance area seems to lift the pair towards 1.0960 resistance zone. Major resistance, however, is now pegged near 1.0990-1.1000 mark, also coinciding with 50% Fib. retracement level and nearing 50-day SMA. Only a decisive move above 1.1000 strong resistance might negate the possibilities of any further near-term weakness for the pair and the pair then might continue climbing higher towards testing its next major resistance near 1.1100 mark, representing 38.2% Fib. retracement level.
GBPUSD
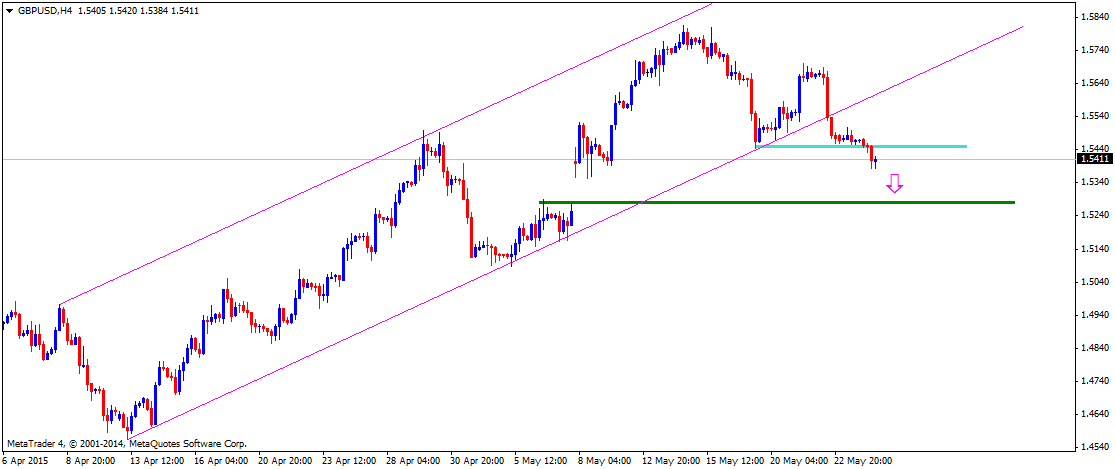
Following a decisive break below a short-term ascending trend-channel, the pair on Tuesday dropped and is trading below previous week low support near 1.5445-40 area. Hence, from current levels a sustain trade below 1.5400 mark now seems to increase the pair’s vulnerability to continue drifting lower, below 1.5300 mark, towards testing 1.5280-70 support area with a minor intermediate support near 1.5350 level. On the upside, horizontal support break point near 1.5440-50 area now seems to provide immediate resistance. This is followed by a strong resistance near 1.5500 psychological mark. A decisive strength above 1.5500 mark resistance might negate the near-term bearish outlook and could immediately lift the pair back towards its next resistance near 1.5580-1.5600 mark.
USDJPY
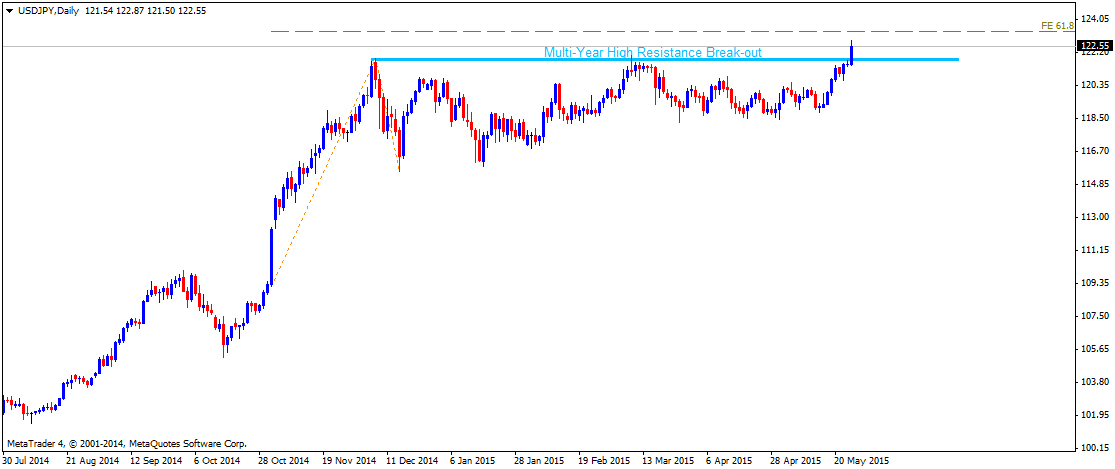
After moving in a trading range for over two-months, the pair on Tuesday provided a break-out and rose to 122.87 level its highest level since July 2007. The break-out momentum to sustain at higher levels and hence from current levels, the pair seems more likely to continue trending higher towards testing its next major resistance near 123.30-40 area, marking 61.8% Fib. expansion level. Considering that the pair has broken out from a multi-month trading range, the positive momentum could lift the pair, even beyond 123.30-40 resistance area, towards 124.00 mark psychological resistance level which was earlier tested in June 2007. Meanwhile on the downside, the resistance break point near 122.00-121.80 zone now seems to protect immediate downside for the pair. Any weakness below 122.00 mark is likely to be short-lived and seems to be limited till 121.50-30 horizontal support area.
NZDUSD
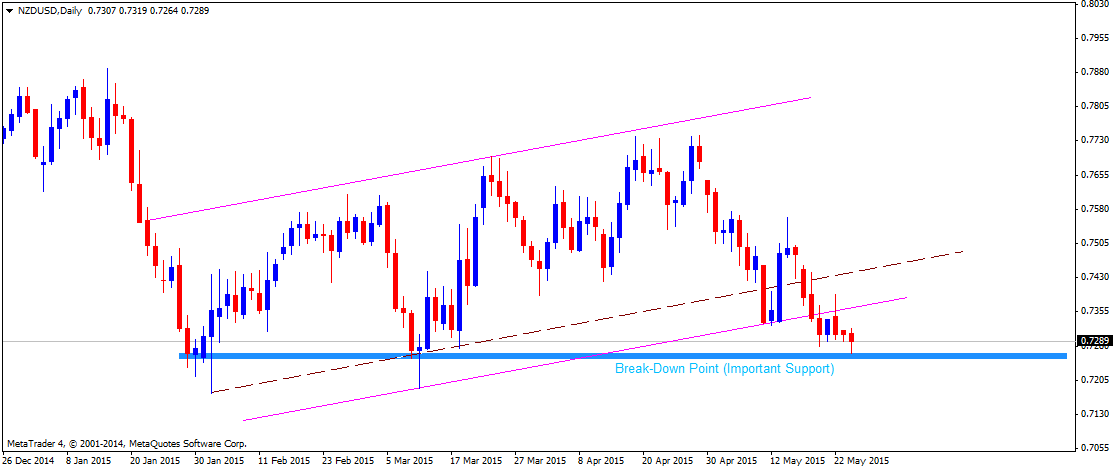
On daily chart, the pair clearly seems to have broken below the lower trend-line support of a short-term ascending trend-channel, possibly suggesting continuation of the downward trajectory in the near-term. The pair, however, has has managed to hold and rebound from a strong support near 0.7250 level, marking its daily closing lows for 2015. Hence, a decisive break below 0.7250 now seems to accelerated the downward momentum, possibly even below its recent intraday lows support near 0.7180-75 area, towards testing its next major support near 0.7100 mark, level tested in March 2011. On the upside, 0.7310-30 area seems to act as immediate resistance. This is closely followed by previous support now turned resistance near 0.7360-70 area, marked by the break-down point from the short-term ascending trend-channel. Any possible up-move beyond 0.7360-70 resistance now seems to be capped at 0.7400 round figure mark, which if conquered might negate the near-term bearish expectations.
Follow me on twitter @Fx_Haresh for latest market updates


