GBPCHF After nearly recovering all the loss registered on SNB's surprise move, the pair had witnessed renewed weakness but still managed to hold and
GBPCHF

After nearly recovering all the loss registered on SNB’s surprise move, the pair had witnessed renewed weakness but still managed to hold and bounce back from 1.3800 mark support, nearing 61.8% Fib. retracement level of its post SNB decision up-move. Meanwhile, on 4-hourly chart the pair seems to form a bearish Rising Wedge chart pattern, suggesting a possible resumption of the downward trajectory. The pattern, however, is confirmed only once the pair decisively breaks below the lower trend-line support of the wedge, currently near 1.4500 mark. A decisive break below 1.4500 mark now seems trigger an immediate fall towards 1.4400 mark horizontal support and eventually towards testing its next major support near 1.4220-1.4200 area, nearing 38.2% Fib. retracement level. Meanwhile a move back above 1.4600 mark is likely to confront a strong resistance near 1.4680-1.4700 area, representing the upper trend-line resistance of the Wedge. A decisive break above this resistance might negate the bearish formation, thus paving way for continuing the near-term upward trajectory back towards 1.5000 psychological mark resistance.
GBPNZD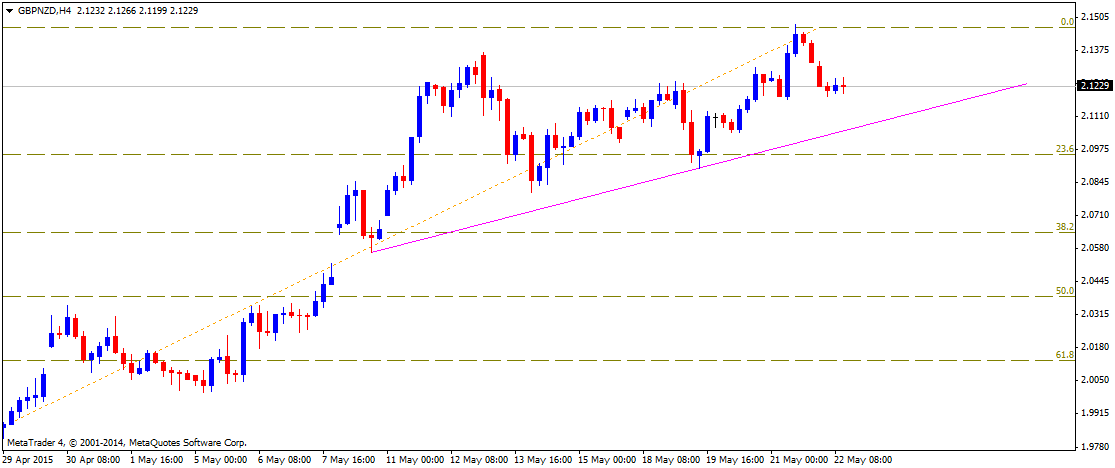
On Thursday, after testing its highest level since March 2011, and also on Friday, the pair is witnessing some profit-taking move from higher levels. From current levels, a drop below 2.1200-2.1180 immediate support seems to accelerate the corrective move towards a short-term ascending trend-line support near 2.1060-50 area. A decisive break below this trend-line support could extend the corrective move towards retesting an important resistance turned support near 2.0960-40 area, also coinciding with 23.6% Fib. retracement level of the sharp up-move witnessed from lows tested in April to Thursday’s high. Meanwhile on the upside, 2.1330-50 zone now seems to provide immediate resistance and a on decisive strength above this immediate resistance the pair seems to aim level beyond 2.1500 mark resistance towards 2.1620 resistance area.
NZDJPY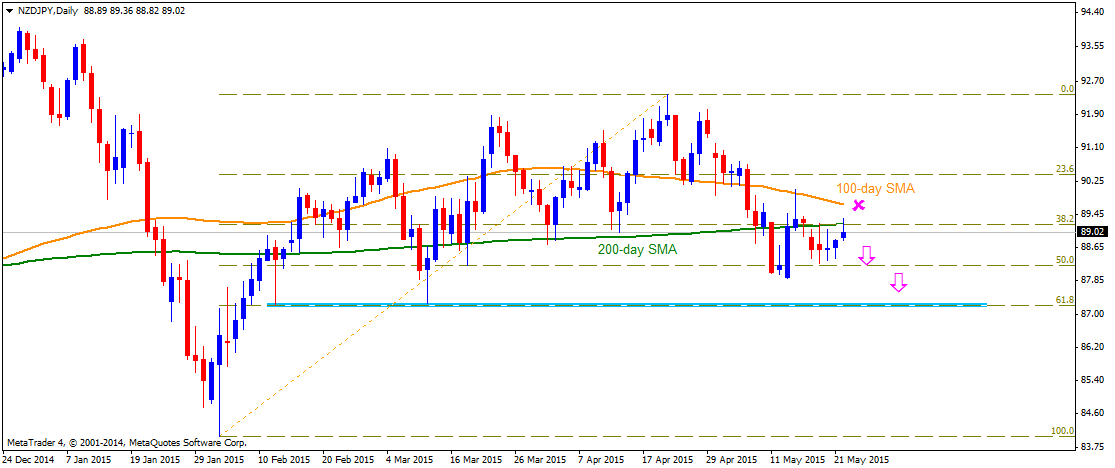
Following the pair’s weakness back below 100-day SMA and a subsequent drop below 200-day SMA, the pair seems to have found some support near 88.00 mark, nearing 50% Fib. retracement level of Feb. to April 2015 up-swing. The pair, however, is now facing resistance at 200-day SMA, currently near 89.20-30 zone, also coinciding with 38.2% Fib. retracement level. A move above 200-day SMA resistance now seems to face strong headwind at 100-day SMA, currently near 89.70-80 zone, which now seems to cap near-term up-move for the pair. Meanwhile, a drop back below 88.60-50 zone now seems to trigger the required momentum to drag the pair back below 88.00 mark towards testing a very important support near 87.20-87.00 area, representing 61.8% Fib. retracement level. Until the pair continues trading below 200-day SMA it seems vulnerable to test lower level. However, a decisive move above 200-day SMA and a subsequent strength above 100-day SMA might negate the short-term bearish outlook for the pair.
Follow me on twitter @Fx_Haresh for latest market updates