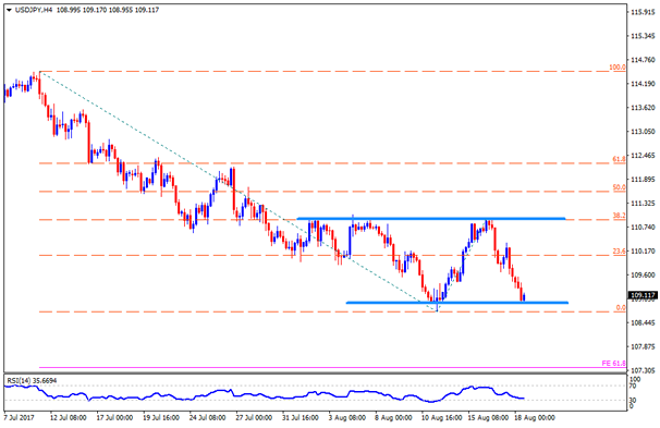
USD/JPY Following its failure to clear 110.90–111.00 horizontal-resistance, the USDJPY presently tests the 108.90-95 support-zone with oversold RSI
Following its failure to clear 110.90–111.00 horizontal-resistance, the USDJPY presently tests the 108.90-95 support-zone with oversold RSI signaling brighter chances of its pullback to 109.50, 109.80 and the 110.35. Given the pair’s ability sustain a break above 110.35, it can again confront 110.90 – 111.00 area, breaking which 111.55 & 112.20 can come-back on the chart. Alternatively, the pair’s extended declines below 108.90 may take halts around 108.30 and the 108.00 round-figure prior to targeting the 61.8% FE level of 107.40. In case if sellers continue demanding more after conquering 107.40, the 106.90 & 105.80 should flash in their radar.
EURJPY’s break of 50-day SMA indicates the pair’s downside towards testing 127.50-40 support-zone, clearing which it could further drop to 126.40 and then to 125.80. During the pair’s additional south-run after 125.80 break, 100-day SMA level of 124.90 becomes critical for traders to watch. On the upside, 128.50 and the 129.00 are likely immediate resistances for prices to surpass ahead of revisiting the 129.60 and the 130.00 mark. Moreover, pair’s sustained trading above 130.00 could again help it to target 130.80, the 131.40 and the 132.00 numbers towards north.
GBPJPY is another JPY pair that portrays the strength of Japanese Yen. The pair recently broke nearly four-month old ascending trend-line and is declining towards 139.00–138.90 horizontal-line. However, 140.00 may offer intermediate stop to the pair’s plunge. If at all the 138.90 is broke on a daily closing basis, chances of witnessing 137.70 and the 137.00 as quotes can’t be denied. Meanwhile, 141.20 can be considered as adjacent resistance for the pair, surpassing which it may confront 142.00 and the support-turned-resistance line of 142.50. Though, 100-day SMA level of 143.20 could restrict the pair’s follow-on recovery, failing to do so can propel Bulls to aim for 50-day SMA level of 144.00.
Cheers and Safe Trading,
Anil Panchal
An MBA (Finance) degree holder with more than five years of experience in tracking the global Forex market. His expertise lies in fundamental analysis but he does not give up on technical aspects in order to identify profitable trade opportunities.