
Advertisement
Advertisement
The Best Trading Opportunity Today – January Natural Gas – November 12, 2015
By:
Today’s focus will be on the January Natural Gas futures market. Although the longer-term fundamentals are bearish because of oversupply, the price action
Today’s focus will be on the January Natural Gas futures market. Although the longer-term fundamentals are bearish because of oversupply, the price action this week suggests a consolidation may be taking place. This typically indicates trader indecision or perhaps an impending change in investor sentiment.
Seasonally, November is the month when natural gas prices start to find support. Greater demand because of the onset of cooler weather often helps support prices. So far this year has been a little different because of the influence of the El Nino phenomena on U.S. weather patterns.
Ample supplies and moderate weather has kept demand for the heating fuel subdued, allowing storage inventories to grow above average levels. Weather-driven demand is usually strong enough at this time of year to offset producer injections. But this year, producers are still injecting more fuel into storage than consumers are withdrawing.
Although the fundamentals present a bearish outlook, the technical chart pattern suggests that short-sellers have been lightening up their positions since forming a potentially bullish closing price reversal bottom on October 30.
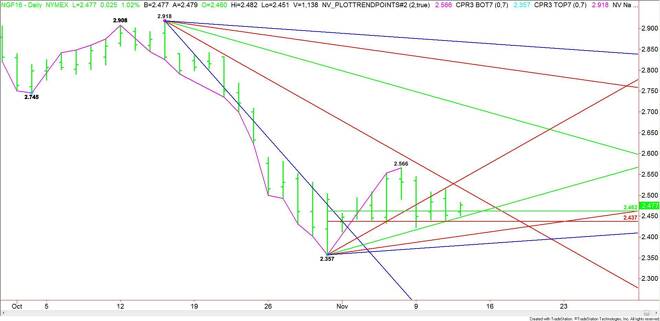
The first rally from the October 30 bottom at 2.357 drove natural gas prices to 2.566 on November 6. The first leg up following the formation of a closing price reversal bottom is usually short-covering. This may have been triggered by oversold conditions or fueled by aggressive seasonal buying.
The new short-term range is 2.357 to 2.566. Its retracement zone is 2.462 to 2.437. This zone is very important because it will determine the next move in the market. Typically, aggressive counter-trend buyers come in on a test of the retracement zone. They are trying to produce a potentially bullish secondary higher bottom and so far this strategy has been holding true with the natural gas market straddling this zone all week.
Additional support has been provided by an uptrending angle from the 2.357 bottom. This angle is passing through the retracement zone at 2.447 today.
It’s a highly speculative play, but aggressive counter trend traders may want to go into tomorrow’s EIA supply and demand report long natural gas from the 2.462 to 2.447 area. The move will fail if sellers drive the market through the Fibonacci level at 2.437.
A failure at 2.437 will indicate that short-sellers are still in control with possible targets at 2.402 and 2.380. The latter is the last potential support angle before the 2.357 main bottom.
The setup is there on the chart, but we’ll still need support from the supply/demand report as well as the weather forecast. Friday’s EIA report for the week-ending November 13 is expected to show a build of 51 billion. Last week’s build was 52 billion. This is well below the 90 to 100 billion builds we saw in October.
A build below the estimate will likely trigger a short-covering rally, however, gains could be limited if the weather forecast doesn’t cooperate. Any mention of cooler weather over the next two weeks will signal a shift in the forecast. This may also encourage further short-covering and perhaps additional buying from seasonal traders.
Today, traders should watch the price action and order flow at 2.462 today. Trader reaction to this 50% level will tell us whether bullish traders are coming in to support the market or if sellers are still in control.
About the Author
James Hyerczykauthor
James Hyerczyk is a U.S. based seasoned technical analyst and educator with over 40 years of experience in market analysis and trading, specializing in chart patterns and price movement. He is the author of two books on technical analysis and has a background in both futures and stock markets.


Advertisement