The USD/CAD is the market to watch today because of its strong correlation to the crude oil market. Last week’s fast turn in the crude oil market has put
The USD/CAD is the market to watch today because of its strong correlation to the crude oil market. Last week’s fast turn in the crude oil market has put the Forex pair in a position to weaken further. This puts the focus on today’s U.S. Energy Information Administration’s weekly inventories report.
The positive correlation between the USD/CAD and oil prices is high and has existed for a long time. Long-term analysis shows that there is a 0.78 positive relationship between the two assets. Simply stated, when crude oil rallies, the USD/CAD is likely to break. You can see from the chart that bottoms in crude oil are closely relate to tops in the USD/CAD.
Another way to look at this chart is to say that if crude oil continues to extend its current rally towards the psychological $50.00 level, the USD/CAD is likely to move towards its recent bottom at 1.2831.
On Tuesday, crude oil prices soared on aggressive speculative buying and short-covering. The catalyst behind the rally were a jump in gasoline prices triggered by a strike at Brazil’s state-run oil producer Petroleo Brasileiro and the closure of the Libyan oil export terminal at Zueitina provided some support to prices.
Late Tuesday, crude stocks rose by an estimated 2.8 million barrels in the week to October 30 to 479.9 million, data from industry group the American Petroleum Institute showed on Tuesday. Official inventory data from the EIA will be released later today. It is expected to show inventories rose 2.5 million barrels the week-ended October 30.
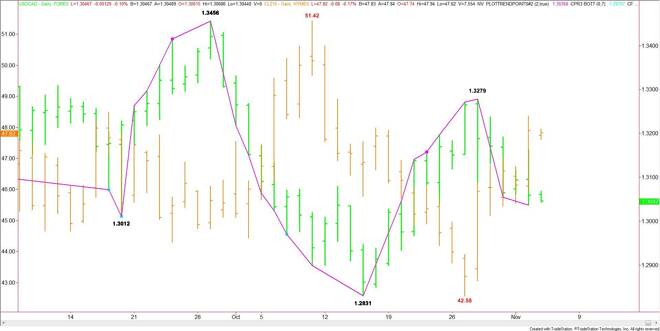
Technically, the main trend is down according to the daily swing chart. The main range is 1.3456 to 1.2831. Its retracement zone at 1.3143 to 1.3217 is currently providing resistance.
The short-term range is 1.2831 to 1.3279. Its retracement zone at 1.3055 to 1.3002 is currently being tested. Trader reaction to this zone will set the tone of the market over the near-term. Bullish traders are going to try to produce a secondary higher bottom inside this zone. Bearish traders are going to try to drive the market through this zone. Reaffirming the secondary lower top at 1.3279 while trying to create enough downside momentum to challenge the recent bottom at 1.2831. A move through this level will signal a resumption of the downtrend.
Based on the close at 1.3060, the first upside target is a steep downtrending angle at 1.3079. Overtaking this angle will signal the presence of buyers. This could trigger a quick rally into an uptrending angle at 1.3111. Overtaking this angle could drive the market into 1.3179.
A sustained move under 1.3079 will indicate the presence of sellers. The daily chart is wide open to the downside with the next target an uptrending angle at 1.2971. The USD/CAD is not likely to reach this level today unless volume and volatility are above average.
Watch the price action and read the order flow at 1.3079 today. Trader reaction to this angle will tell us whether the bulls or the bears are in control. The catalyst behind any move today is likely to be determined by the EIA inventories report at 10:30 a.m. ET.
James Hyerczyk is a U.S. based seasoned technical analyst and educator with over 40 years of experience in market analysis and trading, specializing in chart patterns and price movement. He is the author of two books on technical analysis and has a background in both futures and stock markets.