
Advertisement
Advertisement
The Best Trading Opportunity Today- USD/JPY- November 6, 2015
By:
The USD/JPY is trading in a tight range, but trading higher on low volume ahead of the release of today’s U.S. Non-Farm Payrolls report for October.
The USD/JPY is trading in a tight range, but trading higher on low volume ahead of the release of today’s U.S. Non-Farm Payrolls report for October. Traders expect payrolls growth of 179,000 with the unemployment rate tipped to hold steady at 5.1%. Average hourly earnings, a crucial component of the release given its implications for future inflationary trends, is forecast to rise 0.2% leaving the annual rate unchanged at 2.2%.
The price action this week suggests that investors have taken bullish positions going into the report. We’re going to keep it simple today by looking at just one key level to determine the direction of the market the rest of the session.
Daily Chart Analysis
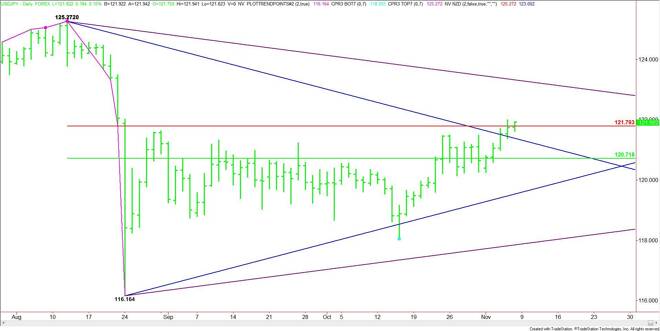
The main trend is down according to the daily swing chart. It turned down back in August. The main range is 125.272 to 116.164. Its retracement zone is 120.718 to 121.793.
Shortly before the release of the jobs report, the Forex pair is straddling the upper or Fibonacci level of the range at 121.793. The direction of the market today will be determined by trader reaction to this level.
A sustained move over 121.793 will signal the presence of buyers. This could create enough upside momentum to fuel a rally into the nearest Gann angle target at 123.335. This is the last potential resistance angle before the 125.272 main top from August 12.
A sustained move under 121.793 will indicate the presence of sellers. However, the selling may be labored because of a couple of potential support levels. The first is a downtrending angle at 121.397. This is followed by the major 50% level at 120.718.
The daily chart opens up to the downside under 120.718 with the next potential target a long-term uptrending angle at 119.539. This angle is another potential trigger point for a further decline into the next major angle at 117.852. This is the last potential support angle before the 116.164 main bottom.
Traders have to be prepared for a choppy, two-sided trade immediately after the release of the report because some traders will react to the headline number and some to the average hourly earnings number. Both could be bullish, both could be bearish and they could neutralize each other.
This being said, I don’t think it’s going to be too important to jump in the market on the release of the report. It will probably be better to let the market settle after the report then read the order flow and the price action at 121.793 to time your entry.
Hourly Chart Analysis
I’ve taken the key angles and retracement zone on the daily chart and placed them on the hourly chart so you can see the potential of this trade and at the same time identify additional intraday target levels. As you can see, there is room to both the upside and the downside over and under 121.793. Therefore, use this price like a pivot all day
Conclusion
Watch the price action and read the order flow at 121.893. Trader reaction to this level will tell us whether the bulls or the bears are in control today. Look for volume and volatility to increase with the release of the U.S. jobs report at 8:30 a.m. ET. Be prepared for a two-sided trade initially because traders will be reacting to the headline number and the average hourly earnings.
About the Author
James Hyerczykauthor
James Hyerczyk is a U.S. based seasoned technical analyst and educator with over 40 years of experience in market analysis and trading, specializing in chart patterns and price movement. He is the author of two books on technical analysis and has a background in both futures and stock markets.


Advertisement