USD/JPY Technical Analysis
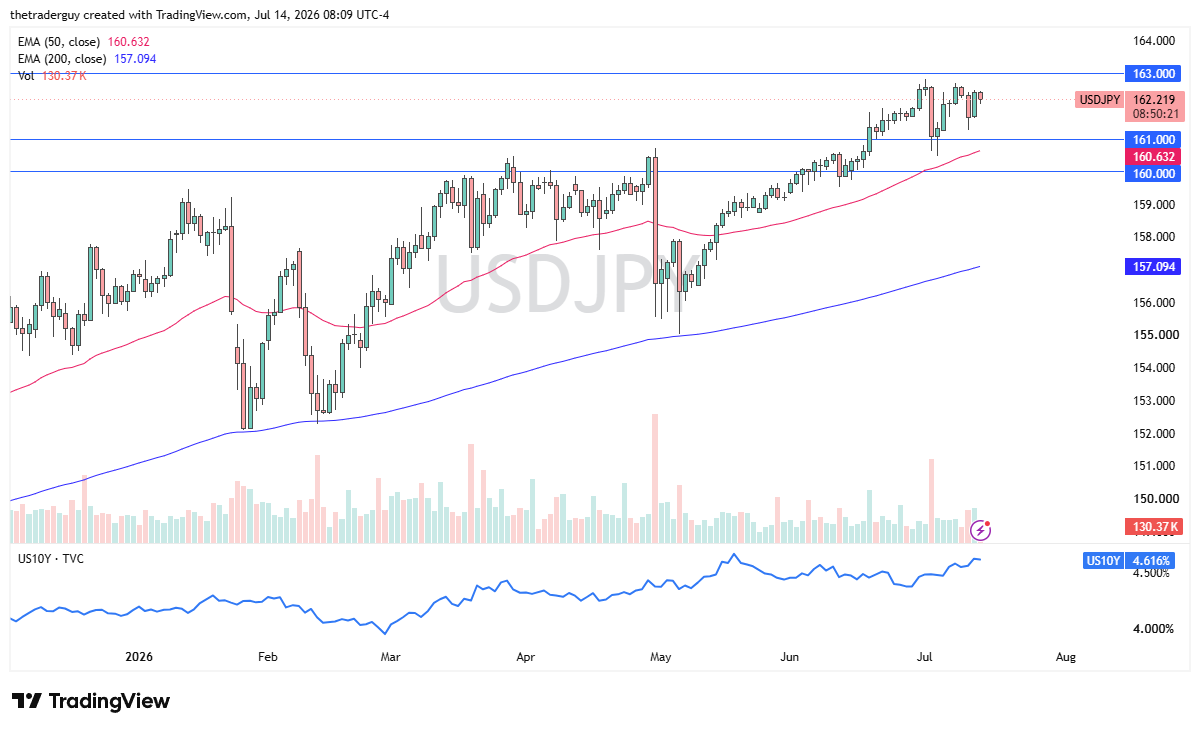
The US dollar has pulled back just a touch against the Japanese yen, but it also looks very much like a market, at least to me, that is still in an uptrend. The sideways grind that we see at this moment is a feature of a market that is torn between the idea that the Bank of Japan may have to be very cautious about the potential of inflation and, at the same time, the destruction of the Japanese yen.
The 161 yen level has recently been supported, and the 50-day EMA heading to that level could offer a little bit of solace for those looking to buy the dip. For myself, I remain bullish on this market and have been long for some time.

AUD/USD Technical Analysis
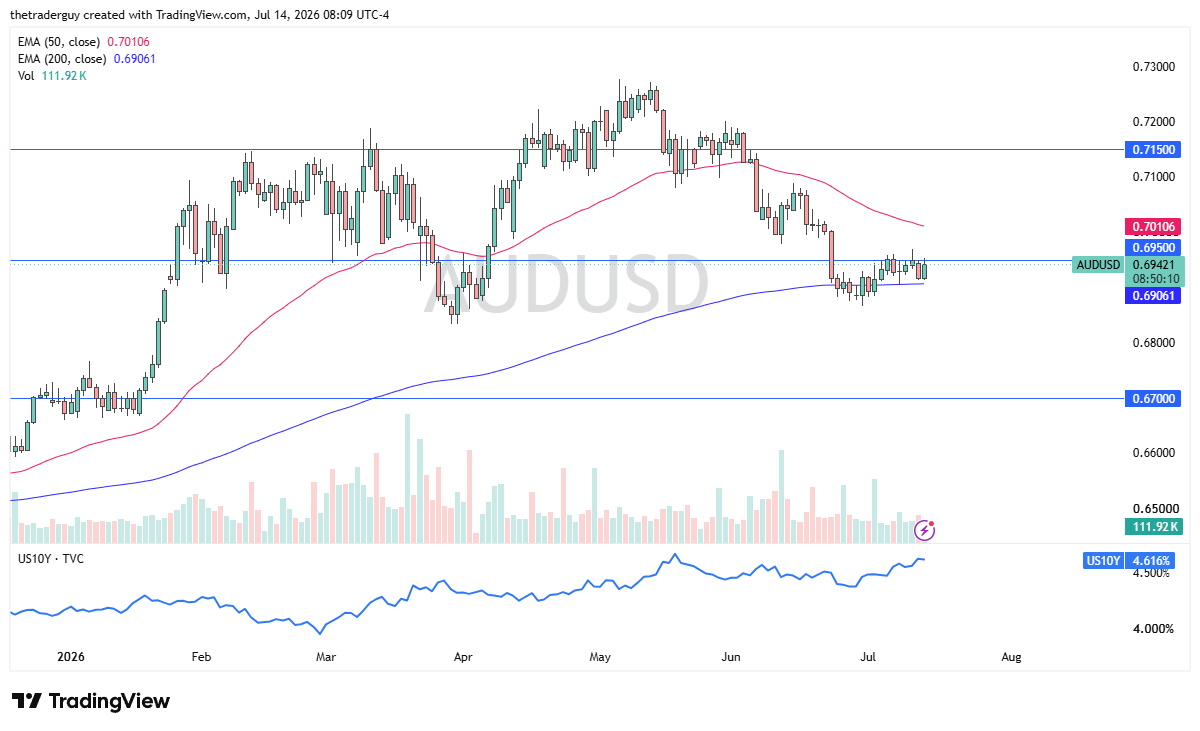
The Australian dollar finds itself at a familiar level in the form of 0.6950. This is an area that will remain important as it was previously supported; it should now be resistant, and with that, I think that it is an area worth watching. Whether or not we can break to the upside remains to be seen, but this juncture, I think, is where we make a bigger decision. We will have to wait and see. Right now, the Australian dollar is very quiet. Sitting on top of the 200-day EMA could be a factor in whether or not there is support.
NZD/USD Technical Analysis
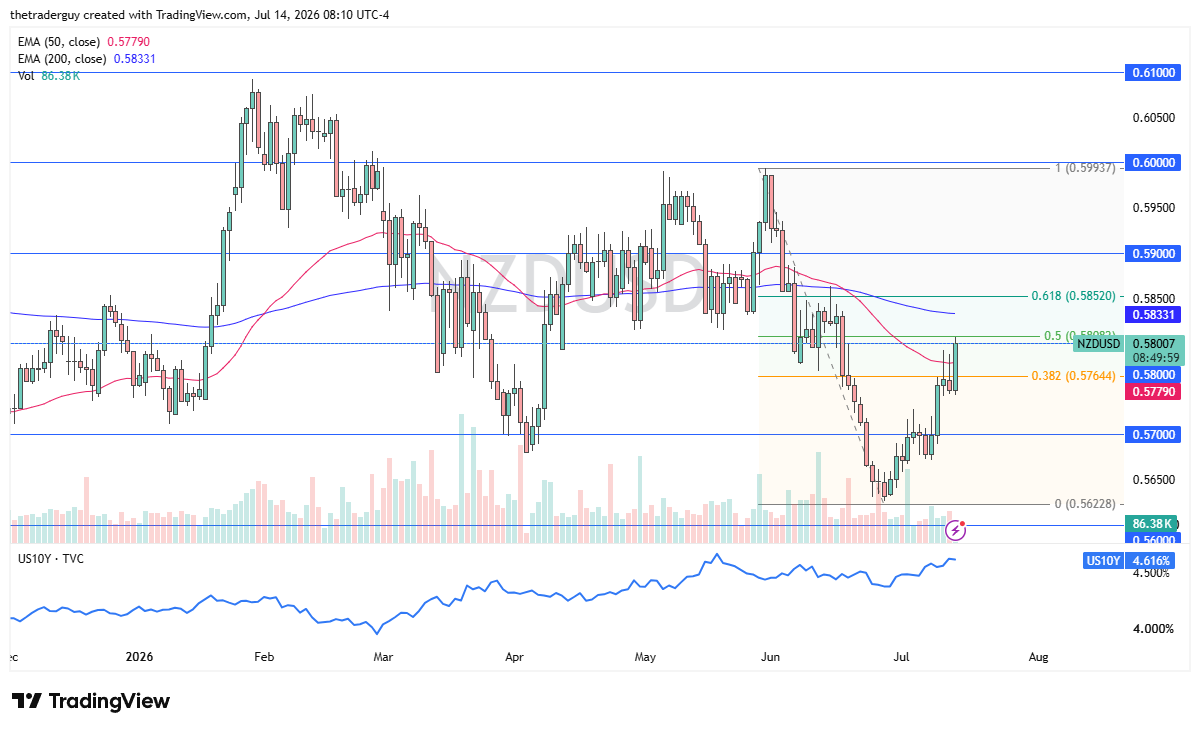
The New Zealand dollar rose pretty significantly during the trading session on Tuesday to test the 0.58 level. The 0.58 level is an area that historically has been important from both support and resistance, and of course, is also the 50% Fibonacci retracement level from the swing high back in June.
The 50-day EMA had offered resistance a couple of days previously, so now the question will be whether or not the New Zealand dollar can continue to the upside.
For myself, I still believe that the interest rate differential favoring the US dollar is a big story here despite the fact that New Zealand just recently raised rates. The United States will continue to pay more in interest than New Zealand even with that rate hike, so I am looking for signs of exhaustion so I can start buying US dollars again, shorting this pair.
AUD/USD Price Forecast
Every new AUD/USD analysis as it publishes, today's technical signal and key levels, live price — on one page.
See all AUD/USD forecastsIf you’d like to know more about technical analysis and how traders use it, please visit our educational area.