
Advertisement
Advertisement
US Dollar Index (DX) Futures Technical Analysis – August 25, 2015 Forecast
By:
The September U.S. Dollar Index is posting a recovery in the pre-market trade. Conditions are relatively calm in the U.S. stock markets, encouraging
The September U.S. Dollar Index is posting a recovery in the pre-market trade. Conditions are relatively calm in the U.S. stock markets, encouraging buyers to step in today after a sharp break on Monday took the market to its lowest level since January 12. The price action suggests that investors may have taken a 2015 rate hike by the Fed off the table.
Weekly Analysis
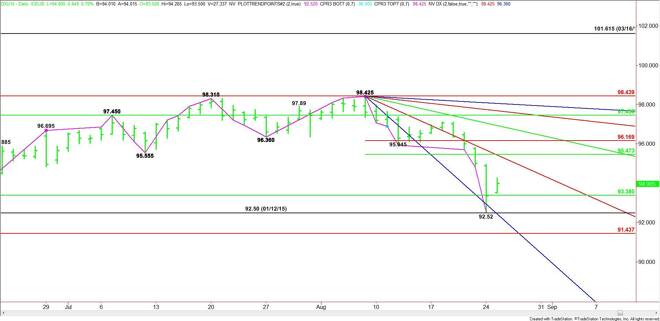
The main trend is down on the weekly chart. It turned down on Monday when the index traded through 93.30.
The main range is the contract range, defined as 85.145 to 101.615. Its retracement zone is 93.38 to 91.44. This zone was tested on Monday.
Support today is the 50% level at 93.38, yesterday’s low at 92.52 and the Fibonacci level at 91.44. Taking out 91.44 could trigger an acceleration down to 90.12.
On the upside, the first target is a downtrending angle at 92.43. This is followed closely by another downtrending angle at 95.87.
The direction of the market the rest of the week is likely to be determined by trader reaction to the 50% level at 93.38.
Daily Analysis
The main trend is down according to the daily swing chart. The index found support at 92.52 which was inside the 93.38 to 91.44 retracement zone and slightly above the 92.50 main bottom from January 12.
Tuesday’s opening was over the 50% level at 93.38. This could trigger a rally into the next downtrending angle at 95.43.
The new minor range is 98.425 to 92.52. Its retracement zone at 95.47 to 96.17 is the primary upside target. Look for an acceleration to the upside if 96.17 is taken out with the next target a downtrending angle at 96.93.
Look for a bearish tone to develop on a sustained move under 93.38 with the next target 92.50. This is followed by a downtrending angle at 92.43 and a Fibonacci level at 91.44. The daily chart opens up to the downside under this level.
Watch the price action and read the order flow at 93.38. This will tell us whether the bulls or the bears are in control.
About the Author
James Hyerczykauthor
James Hyerczyk is a U.S. based seasoned technical analyst and educator with over 40 years of experience in market analysis and trading, specializing in chart patterns and price movement. He is the author of two books on technical analysis and has a background in both futures and stock markets.


Advertisement