
Advertisement
Advertisement
US Dollar Index (DX) Futures Technical Analysis – November 12, 2015 Forecast
By:
December U.S. Dollar Index futures are trading slightly better during the pre-market session. Earlier the index broke when favorable labor data drove the
December U.S. Dollar Index futures are trading slightly better during the pre-market session. Earlier the index broke when favorable labor data drove the Australian Dollar higher, but it began to mount a recovery in conjunction with a sell-off in the Euro.
After consolidating all week, we could see good price action today, highlighted by the return of average volatility and volume. The catalyst will likely be comments from several Fed speakers including Chair Janet Yellen. Tomorrow’s U.S. retail sales report will likely be a market moving event.
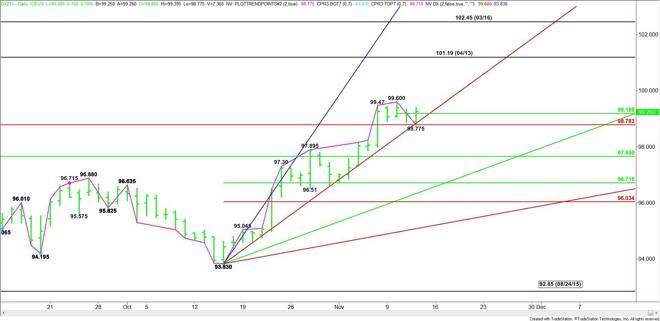
Technically, the main trend is up according to the daily swing chart. The index is currently sitting above a major Fibonacci level, giving it an upside bias today.
The short-term range is 99.60 to 98.775. Its pivot price is 98.19. The direction of the market the rest of the session is likely to be determined by trader reaction to the pivot.
Look for a bullish tone to develop on a sustained move over 98.19. This will indicate the presence of buyers. This could create enough upside momentum to possibly test the main top at 99.60 over the near-term. A trade through 99.60 will reaffirm the uptrend.
A sustained move under 98.19 will signal the presence of sellers. The first downside target is a steep uptrending angle at 98.83. This is followed closely by the major Fibonacci level at 98.78. Earlier in the session, buyers came in at 98.775.
The low at 98.775 is a potential trigger point for a steep sell-off if the level is taken out with conviction. The first major downside target is a 50% level at 97.65. This level is also a trigger point for a move into the minor 50% level at 96.71.
Watch the price action and read the order flow at 99.19 today. Trader reaction to this level will tell us whether the bulls or the bears are in control.
Another level to watch for an upside breakout is 99.60. The key level to watch for the start of a breakdown is 98.775.
About the Author
James Hyerczykauthor
James Hyerczyk is a U.S. based seasoned technical analyst and educator with over 40 years of experience in market analysis and trading, specializing in chart patterns and price movement. He is the author of two books on technical analysis and has a background in both futures and stock markets.


Advertisement