
Advertisement
Advertisement
US Dollar Index (DX) Futures Technical Analysis – October 7, 2014 Forecast
By:
The weak close by the December U.S. Dollar Index has put the market in a position to take out a major uptrending angle on the daily chart at 85.95. This
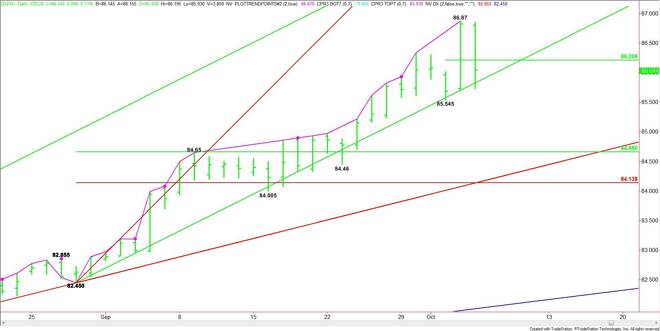
The inside move on Monday also suggests impending volatility. If sellers hit the market hard when testing 85.95, sell stops are likely to be triggered since this is the only logical area to place protection. In addition, long investors may be looking for an excuse to take profits after this prolonged move up in price and time.
The daily chart indicates there is plenty of room to the downside under 85.95. The first target is a major 50% level at 84.66. The next is a long-term uptrending angle at 84.20, followed by the Fibonacci level at 84.14.
The short-term range is 85.545 to 86.87. Its pivot price is 86.21. If sellers don’t hit the market hard on a trade through 85.95 then the index may retrace back to this level. Overcoming the pivot will give the index an upside bias once again.
The tone of the market today will be determined by trader reaction to the angle at 85.95. Watch the volume and order flow when this price is tested. A break through this angle on big volume will indicate strong selling pressure.
About the Author
James Hyerczykauthor
James Hyerczyk is a U.S. based seasoned technical analyst and educator with over 40 years of experience in market analysis and trading, specializing in chart patterns and price movement. He is the author of two books on technical analysis and has a background in both futures and stock markets.


Advertisement