



Dollar Firms as Sticky Inflation Reinforces Cautious Fed Stance
The dollar was firm on May 29, 2026, thanks to stubborn inflation after last month’s stronger-than-anticipated US CPI report. Headline and core figures were elevated and have lowered expectations for Fed rate cuts under Warsh soon.
The euro is trading cautiously as the ECB sounds more accommodative on softer Eurozone data. The sterling is also cautiously traded as the Bank of England remains data-dependent given mixed UK figures and lingering global concerns.
Although the Trump-Xi summit may be in play given the US-Iran ceasefire conditionally holds after eight-plus weeks, inflation data is supporting the dollar. Expect further movement and uncertainty as the dollar remains underpinned on inflation until further Fed commentary and data comes out.

DXY Consolidates at $99.13 – Red MA Rejection in 1h Frame
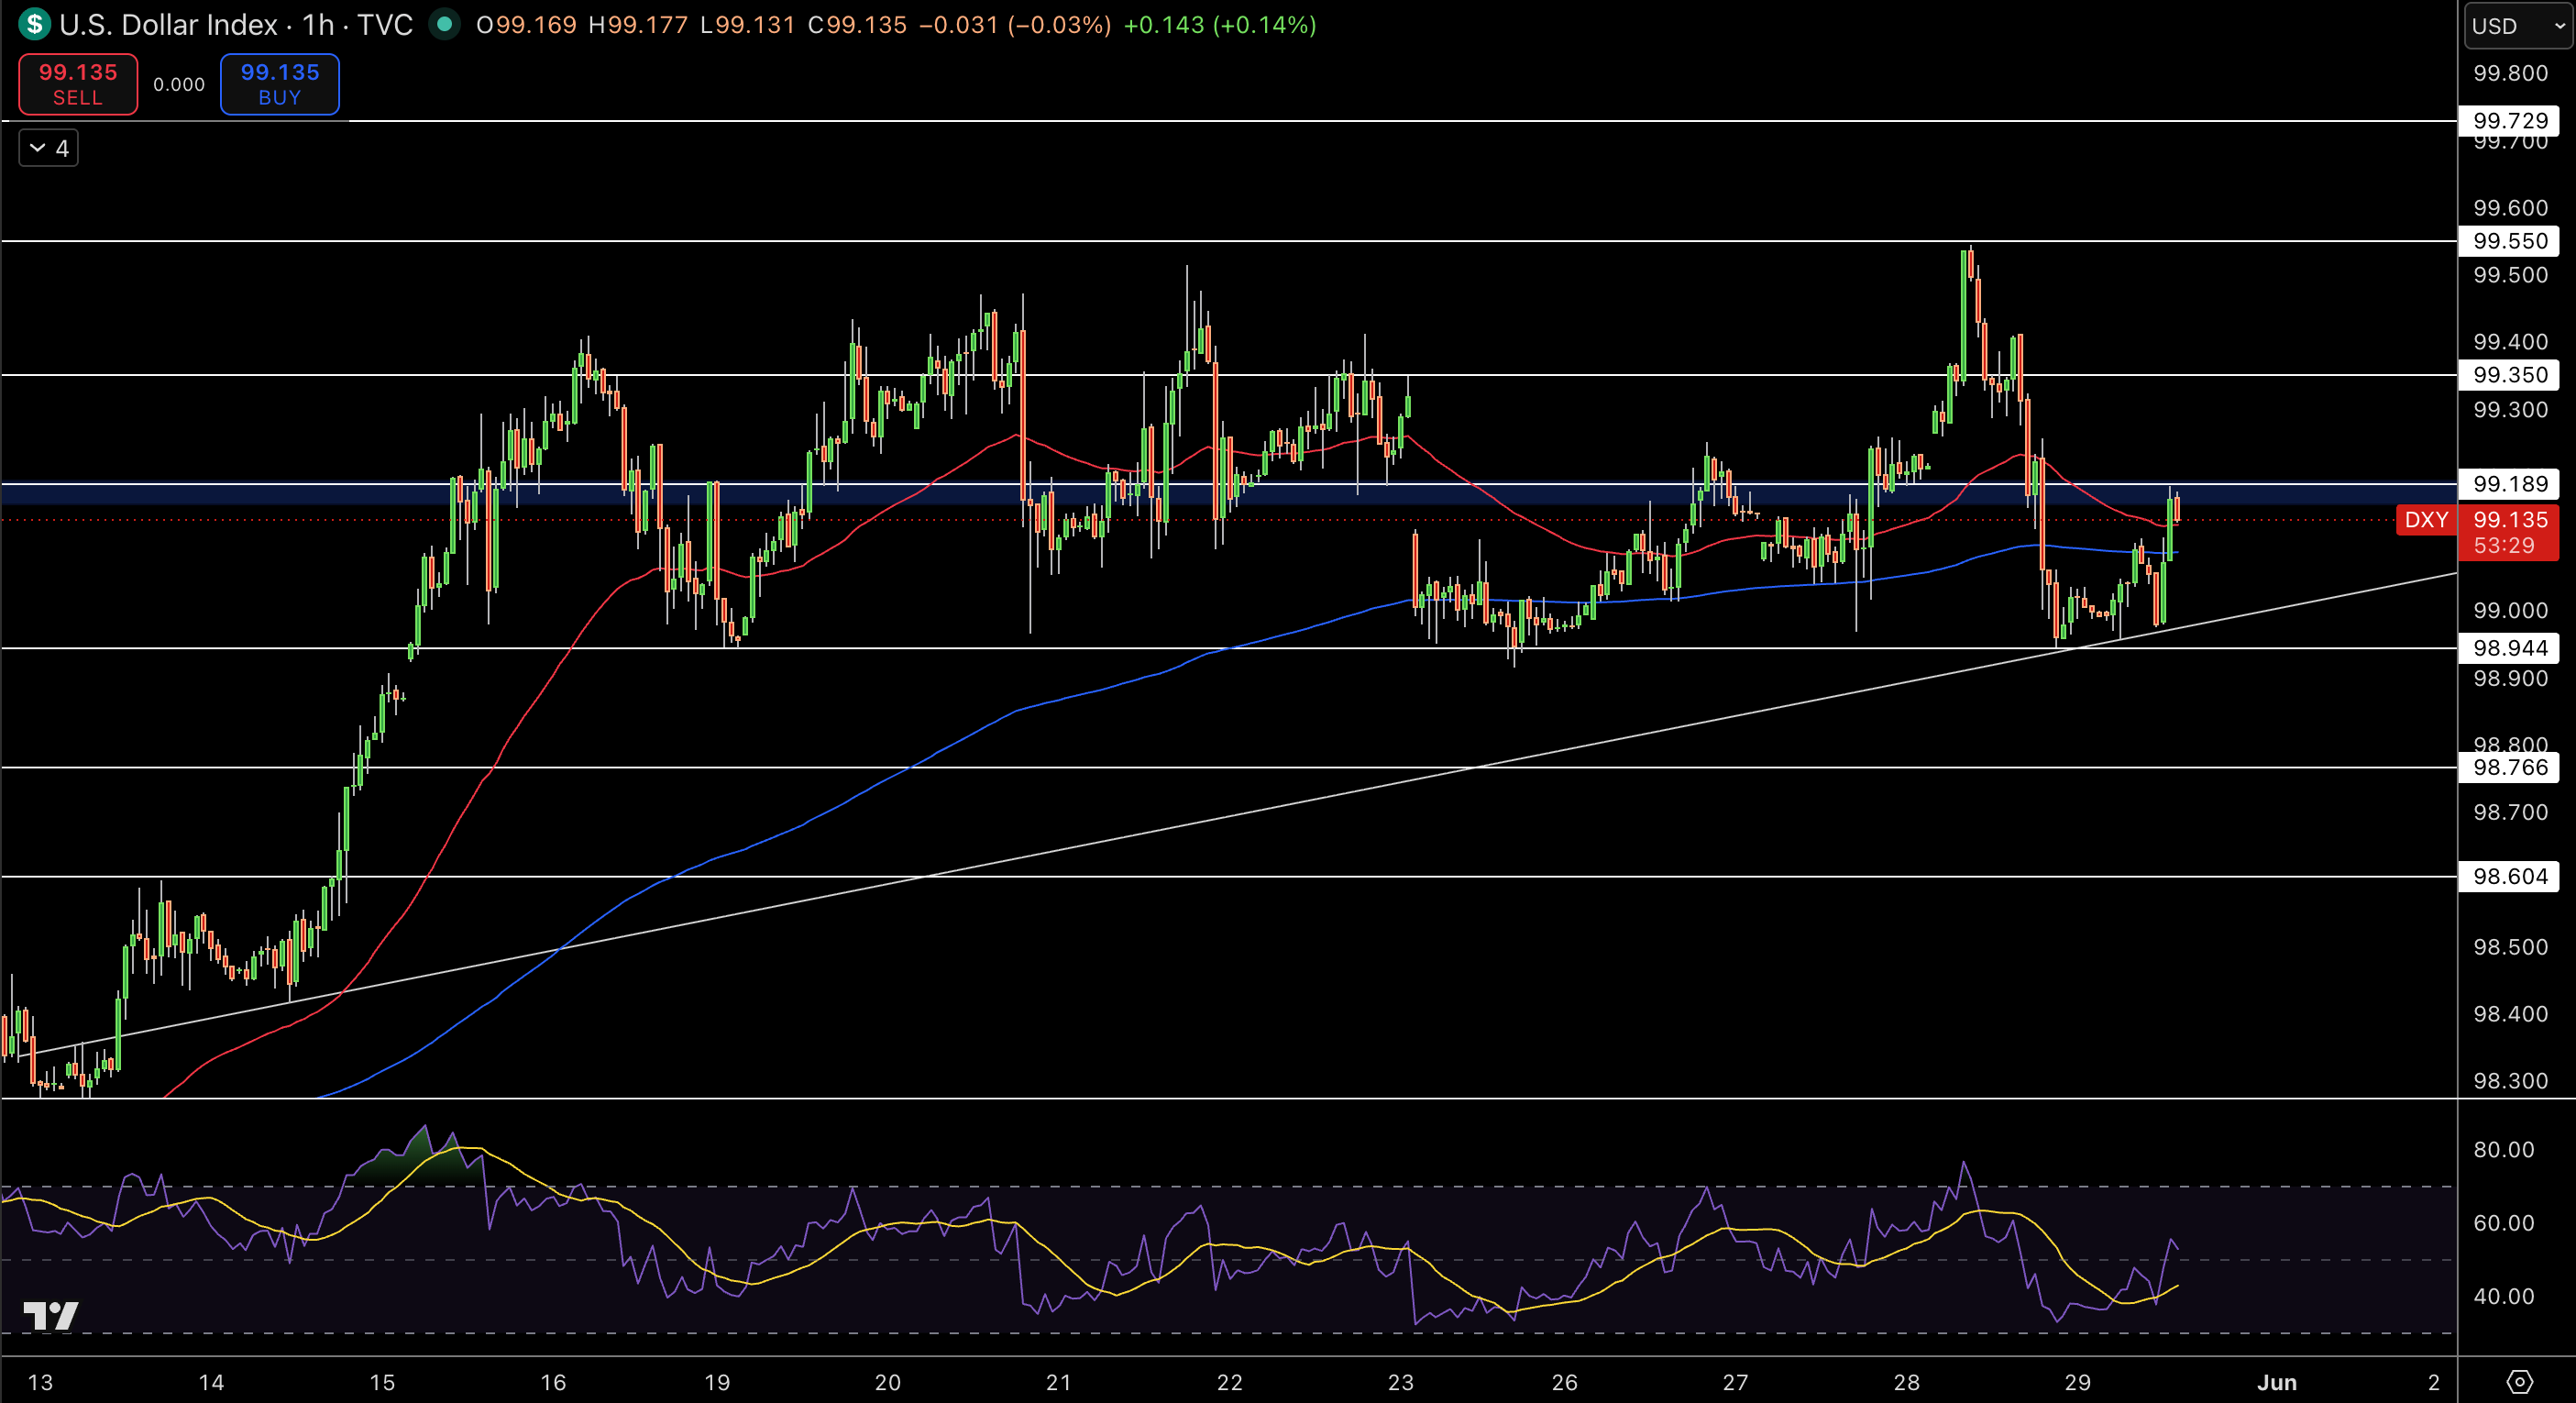
On the one-hour chart, the green and red price action bounced off a $99.25 red 50 MA and white downward trendline. Price remains above a blue upward trendline at $99.00 as higher lows are in place. Price action prints a rejection candle at $99.35.
RSI hovers near 52 and does not print any divergence. $98.94 has acted as support and volume is building as buyers defend the level. Fib retracement from recent swing projects $99.18 to $99.35 next upside cluster.
The structure remains bullish and bullish-neutral so long as price trades above $98.94 as consolidation remains within the short-term range after price broke out earlier. The $99.25 red 50 MA caps price from rising further.
Trade Idea: Buy $99.13 targeting $99.35, stop $98.94.
GBP/USD Price Forecast
Every new GBP/USD analysis as it publishes, today's technical signal and key levels, live price — on one page.
See all GBP/USD forecastsGBP/USD Dips to $1.3415 – Rising Channel Floor Test
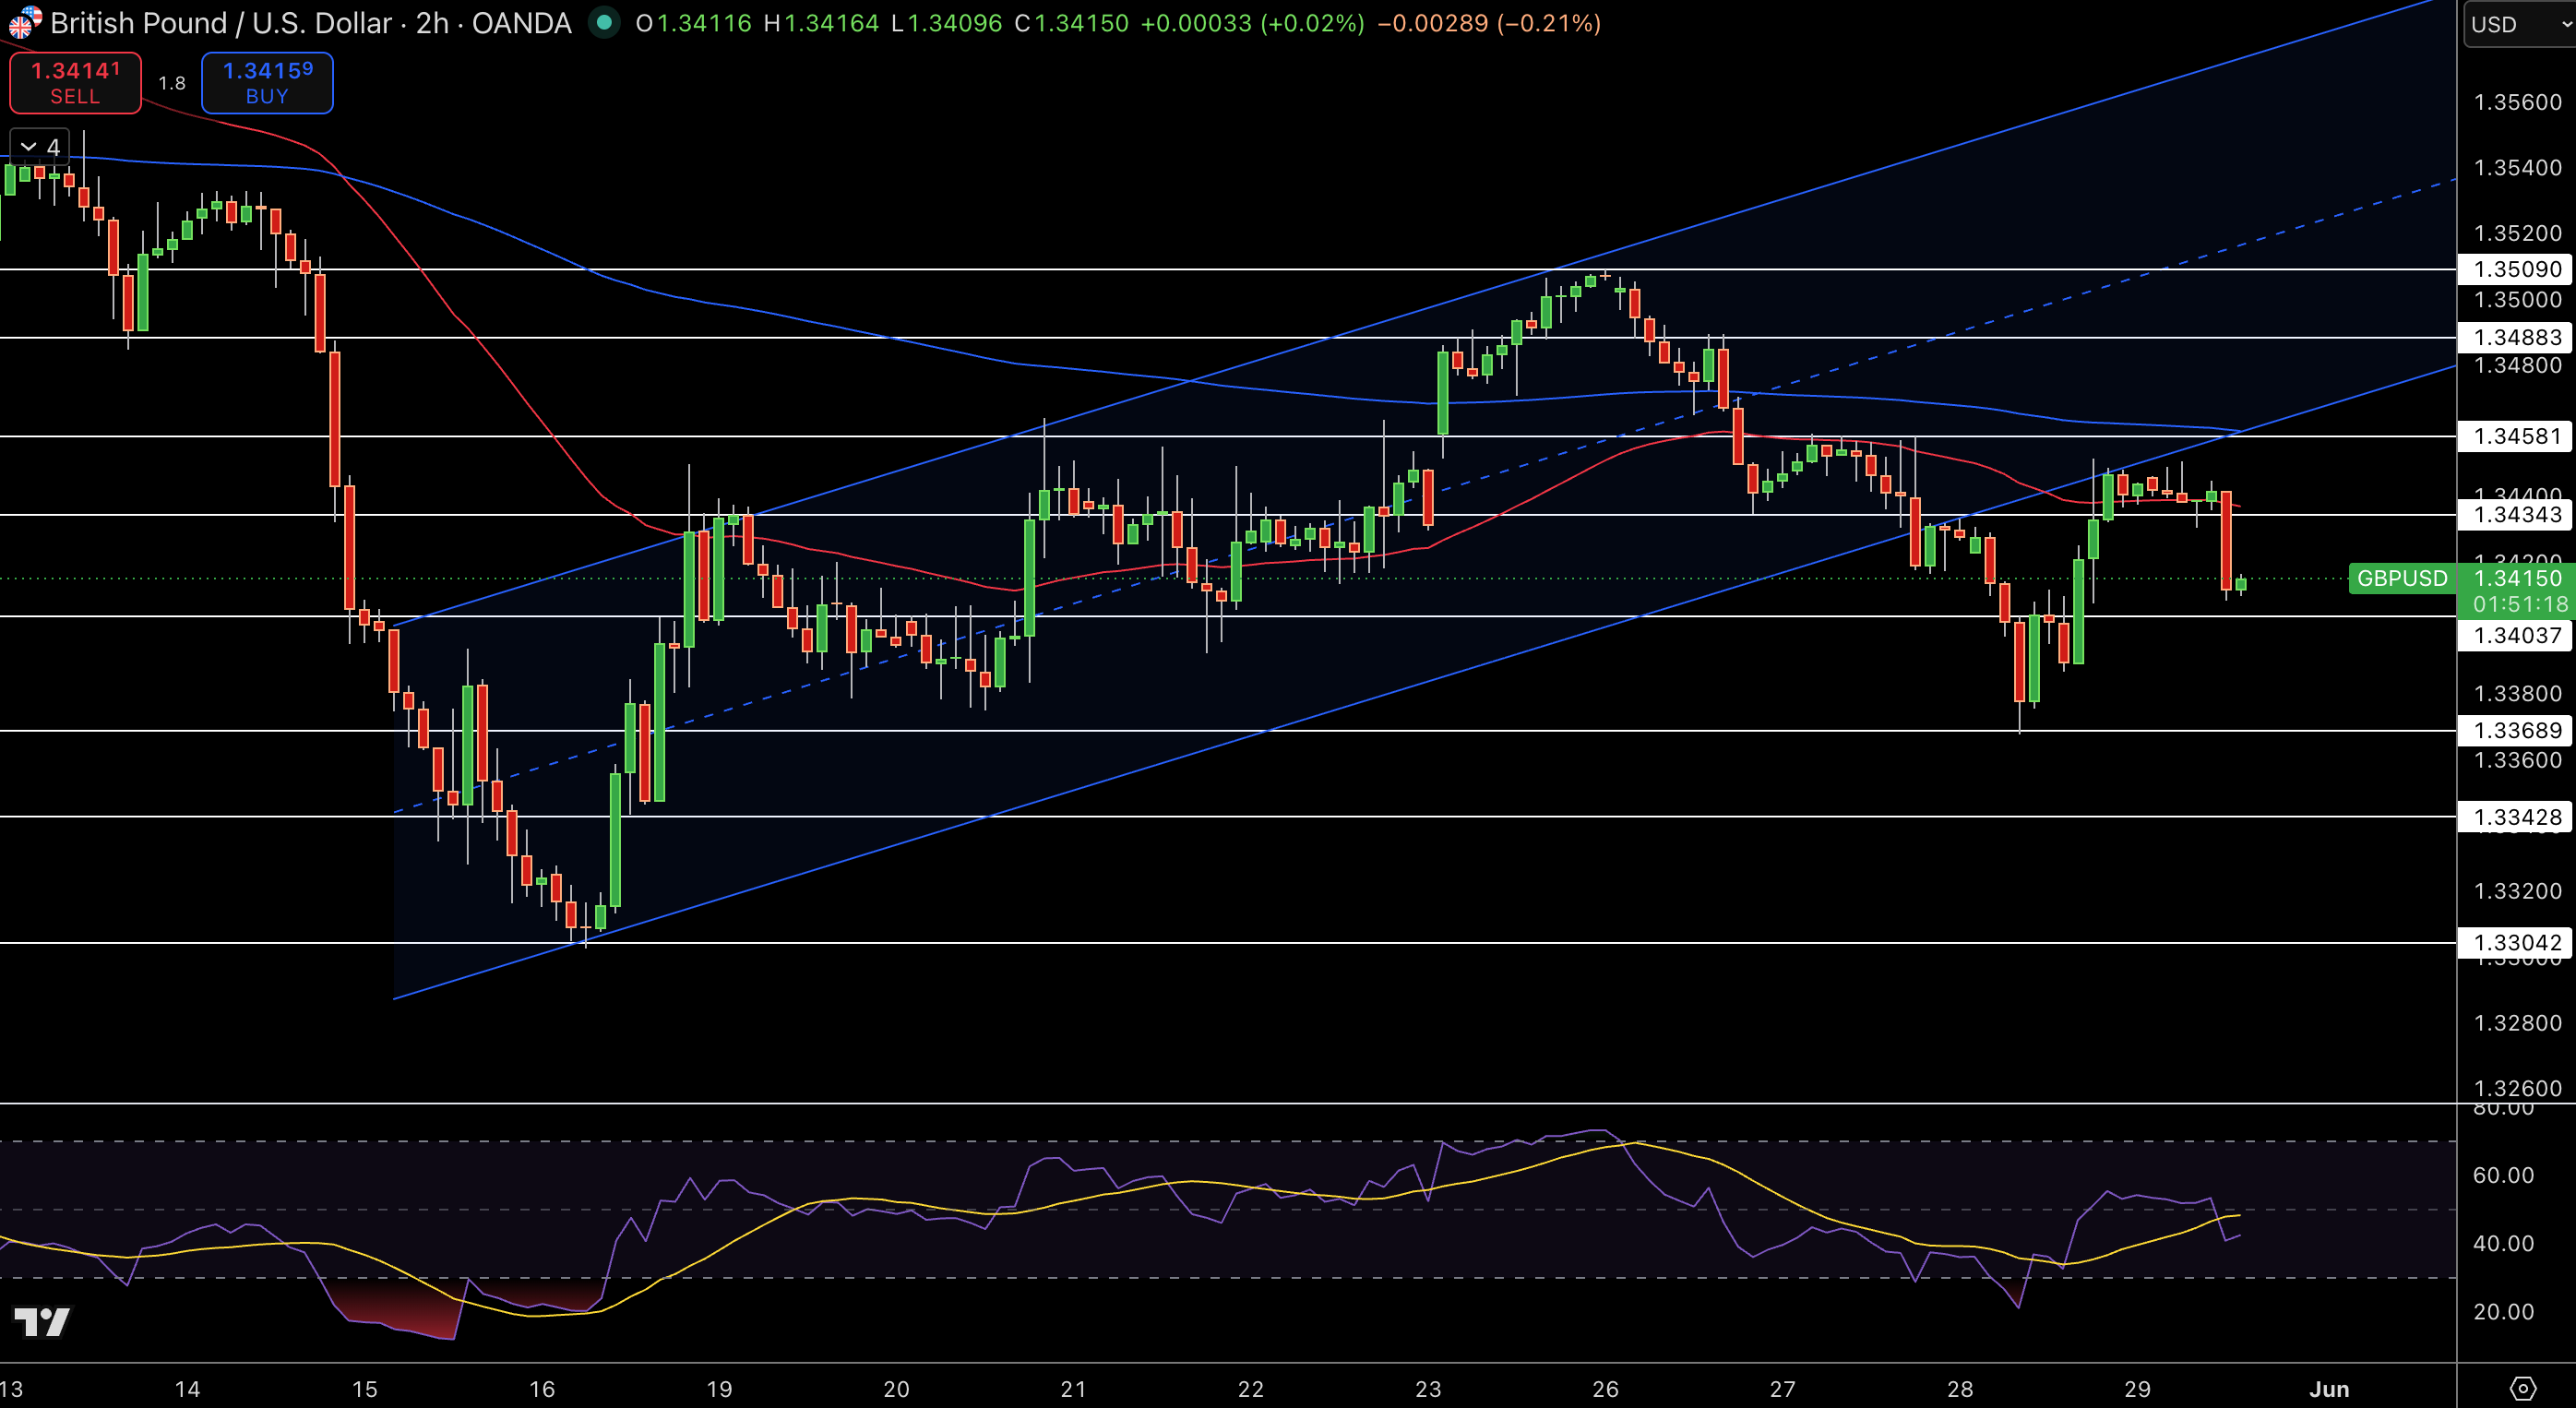
On a two-hour chart, the GBP/USD price tests the white $1.338 trendline along with the $1.338 0.382 Fib retracement as the price action moves south from red candles. The $1.345 red 50 MA overhead is in place.
Higher lows continue to remain inside the channel. RSI near 50 with a neutral pattern. Volume is building as support sits in place. Resistance sits in the $1.345 to $1.348 zone. The structure remains bullish as the higher low zone is intact as the price defends a clean channel floor.
Trade Idea: Buy $1.3415 targeting $1.348, stop $1.338.
EUR/USD Holds $1.1634 – Blue Trendline Defense on 2h
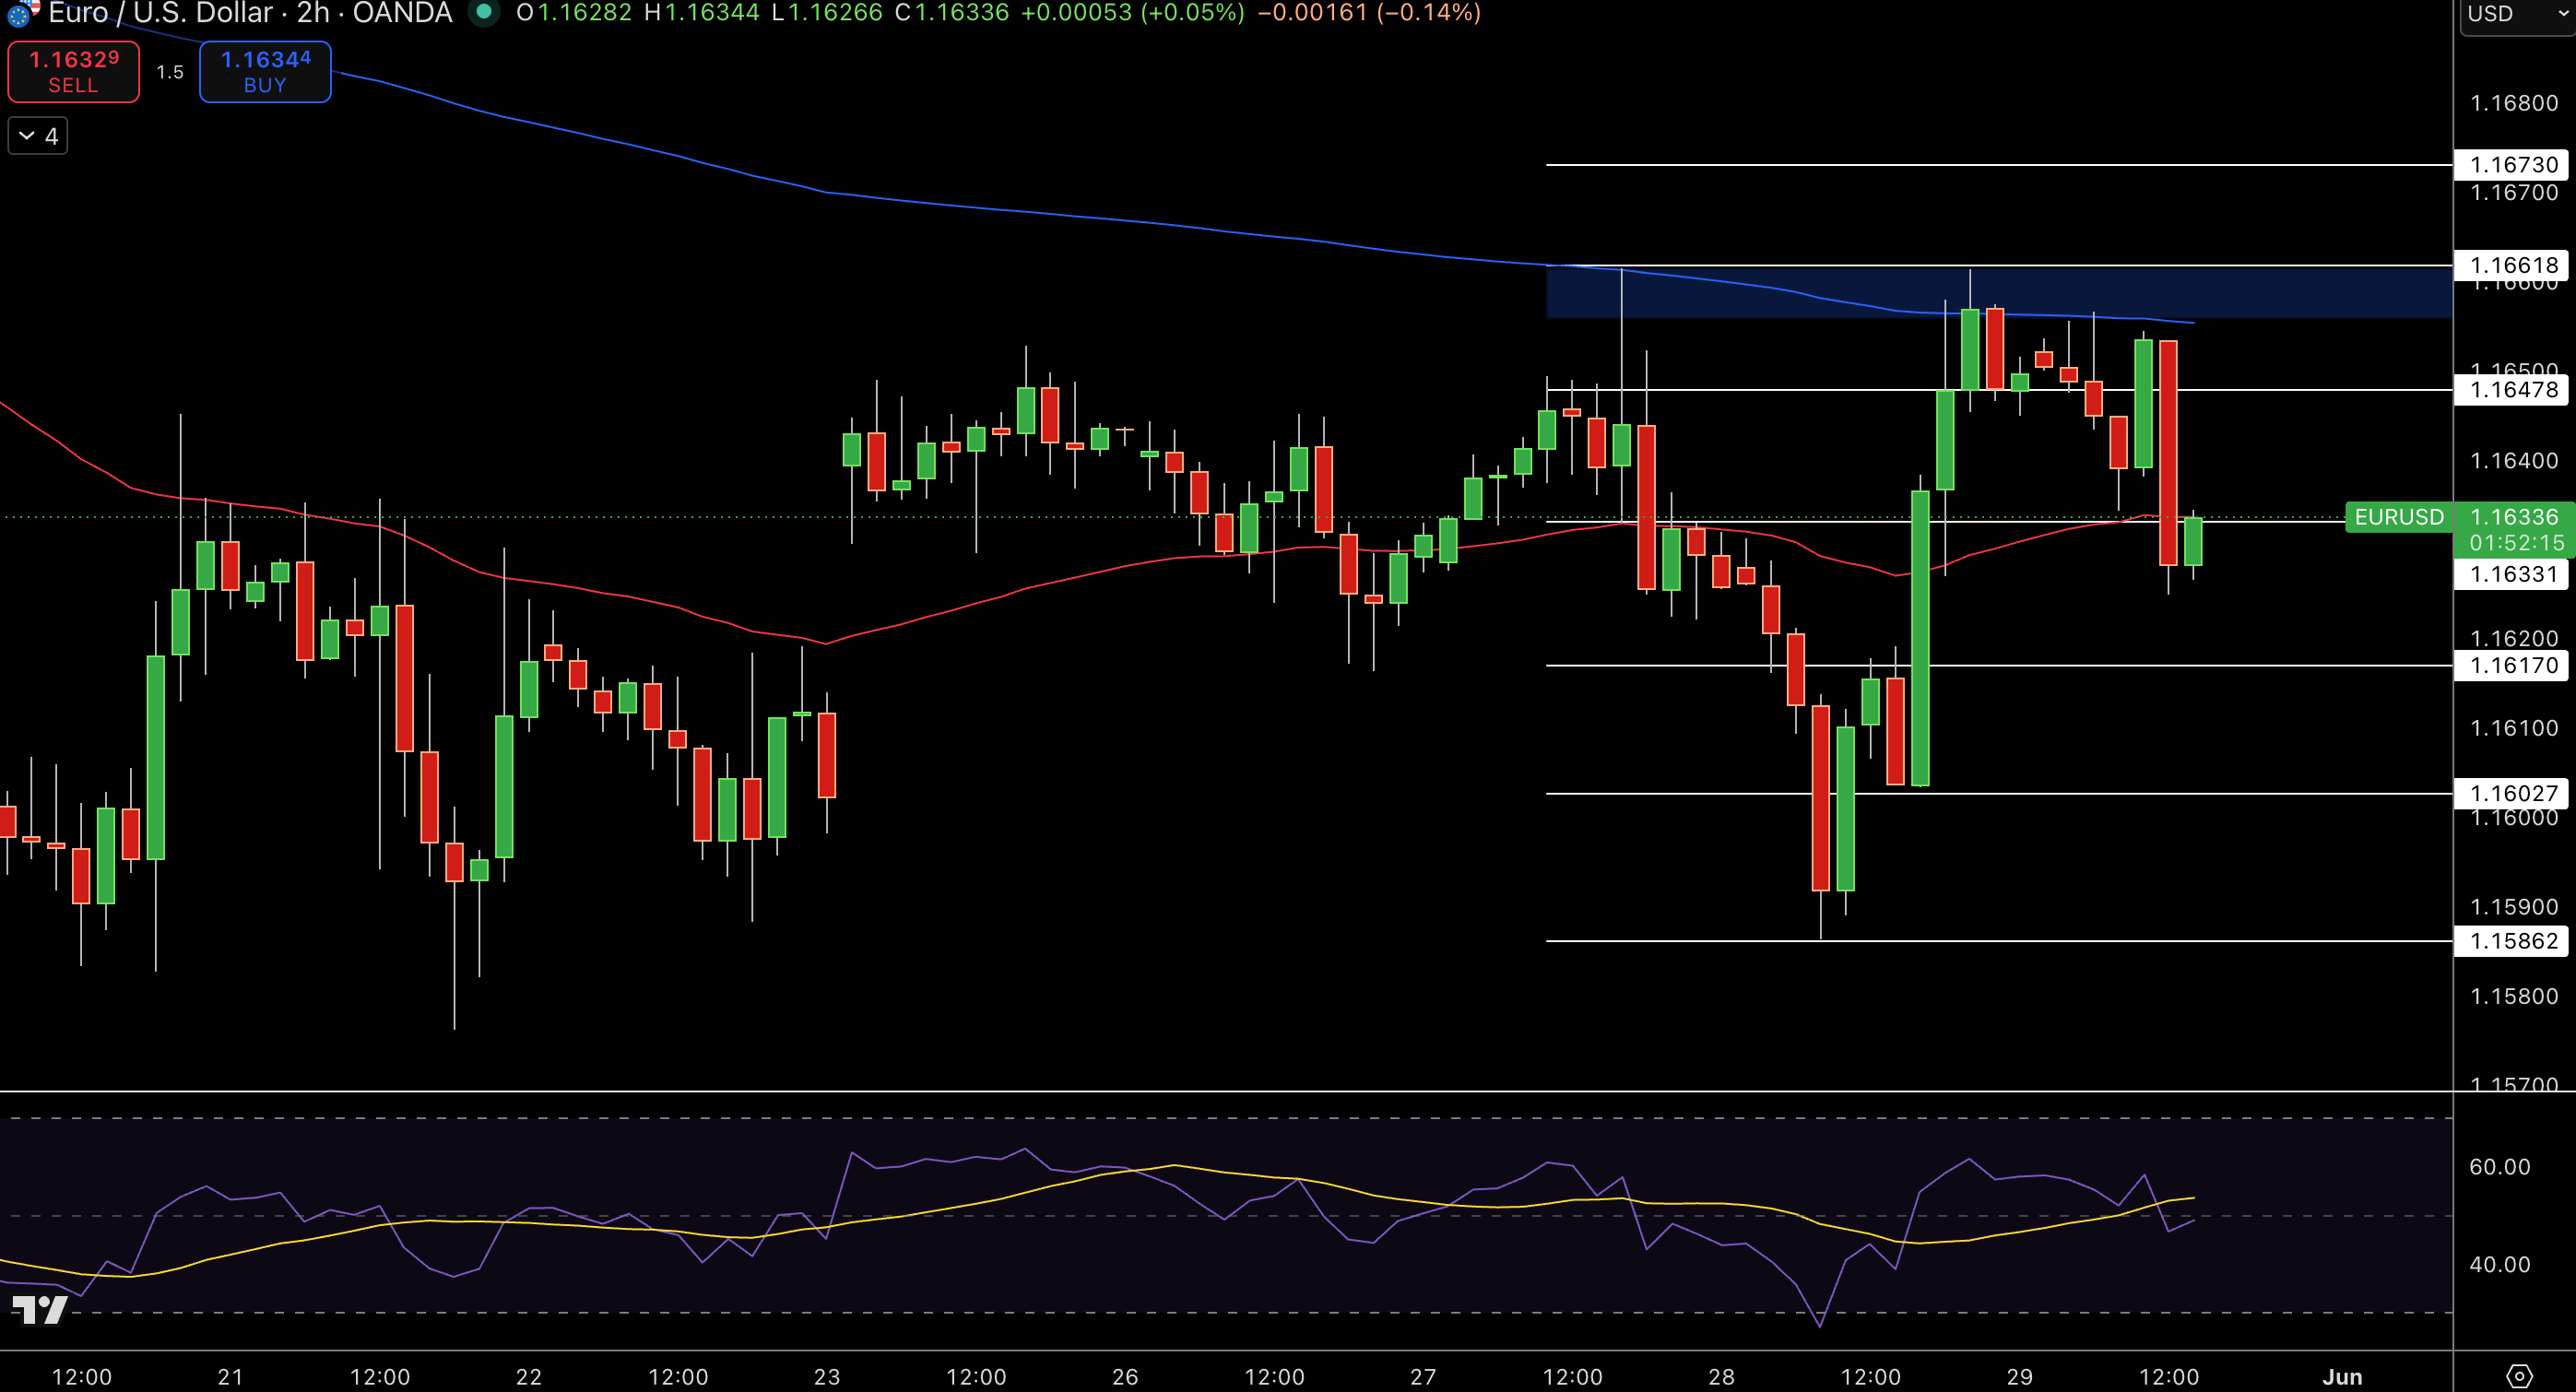
On a two-hour chart of EUR/USD, green candles defend the $1.162 blue trendline and $1.162 0.382 Fib retracement. The $1.166 red 50 MA acts as resistance, along with lower highs. RSI climbs above 48 in a recover pattern. Volume profile shows $1.162 as a pivot point with support being in place.
The $1.162 to $1.168 resistance zone is to the upside. Structure neutral while testing rising channel floor inside broader downtrend. Trade Buy $1.1634, Target $1.166, Stop $1.160.
Trade Idea: Buy $1.1634 targeting $1.166, stop $1.160.


