
US Dollar News: Retail Sales Test Fed Rate Outlook
US dollar is driven today by June retail sales release as well as latest weekly jobless claims. These data releases provide the key drivers as to where we see the Fed heading next. Market participants expect retail sales to report a 0.3% monthly gain after May’s 0.9% decline, while weekly initial jobless claims are also expected to rise modestly to 217,500 from 215,000 last week. If the US sees stronger than expected readings in today’s retail sales releases, together with jobless claims continuing at the lowest levels in history, this will reinforce the notion of continued economic strength in the US economy, leading to higher US rates for longer.
The euro is back in focus as the market thinks that the ECB will keep deposit rate at 2.25% and also its stance is that of data dependent to deal with the inflationary risk. Sterling now seems to be pricing in the Bank of England keeping rates steady with Bank Rate unchanged at 3.75% after a 7 to 2 vote to keep rates steady in June while looking at inflation which stood at 2.8%, labor market conditions softening, and geopolitics being another headwind.

US Dollar Index Technical Analysis: Will DXY Recover From $100.35 or Extend Its Decline?
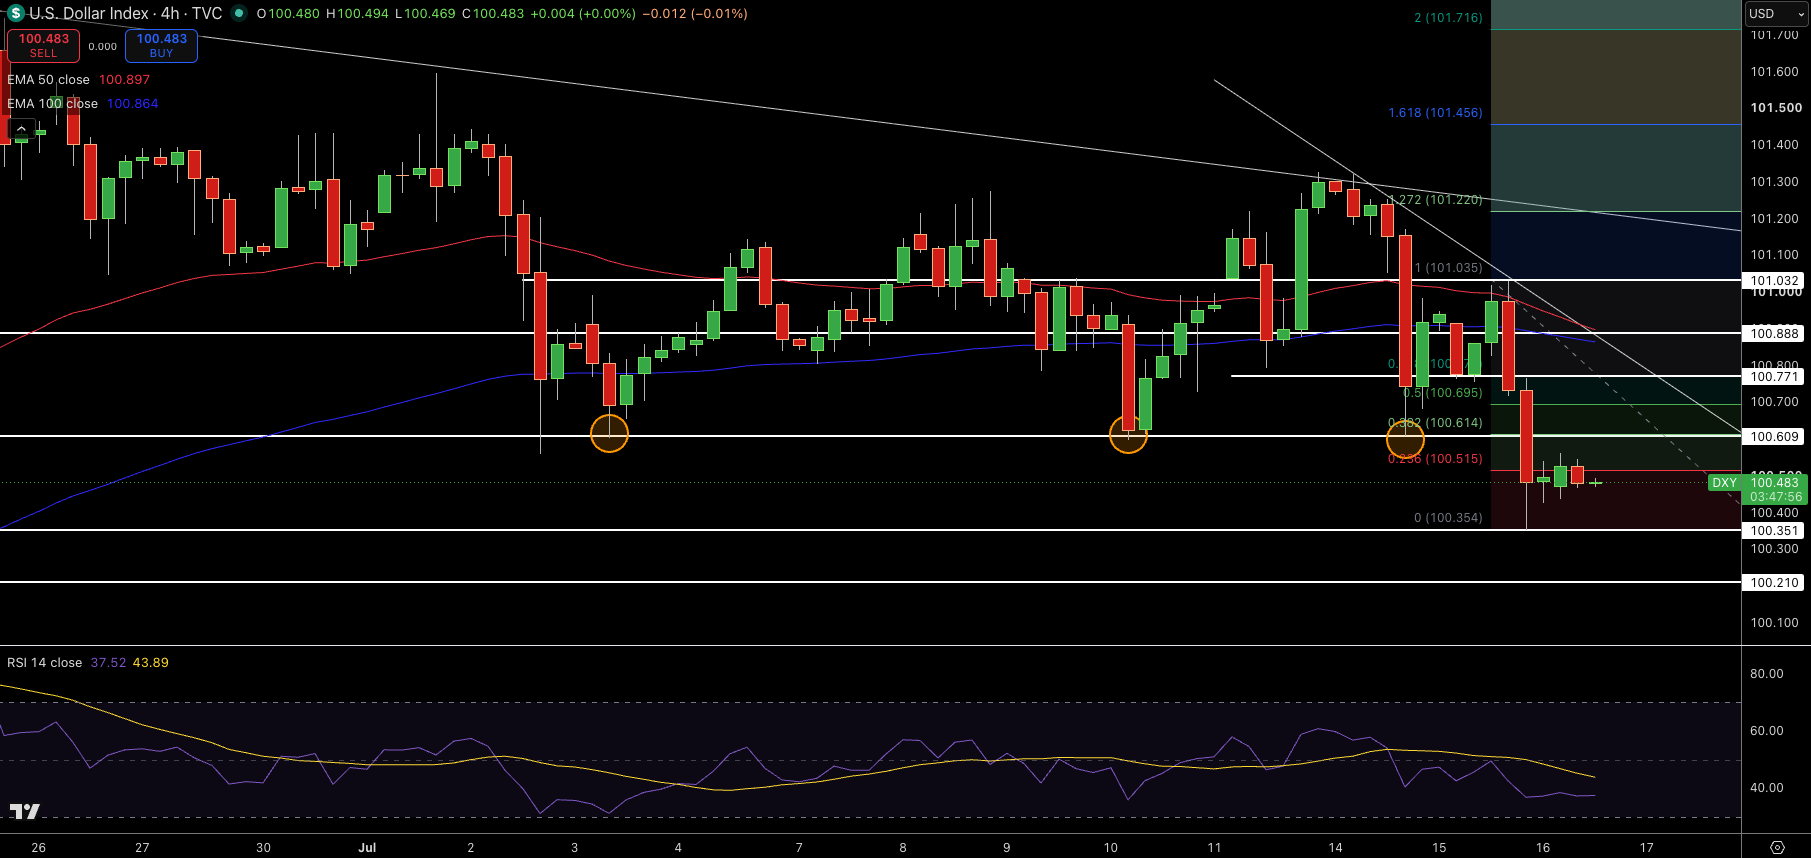
US Dollar Index (DXY) is hovering around 100.48 as it has fallen below both the 50-EMA (at 100.90) and 100-EMA (at 100.86), giving short-term sellers the upper hand. A few sharp red candlesticks sent the index below the descending trendline and the Fibonacci support levels, and it is currently hovering above the 0 level at 100.35. Resistance is at 100.61, then 100.77 and 100.89.
RSI at 38 reflects weakening momentum, which means the pair is in oversold territory, indicating that downside pressures are strong although short-term consolidation could take place. With this in mind, I would avoid any trades until an apparent recovery to the upside of 100.61 is seen, where I would anticipate a trade around 100.89, although the downside of 100.35 remains a threat.
GBP/USD Technical Analysis: Can Bulls Extend the Breakout Toward $1.3560?
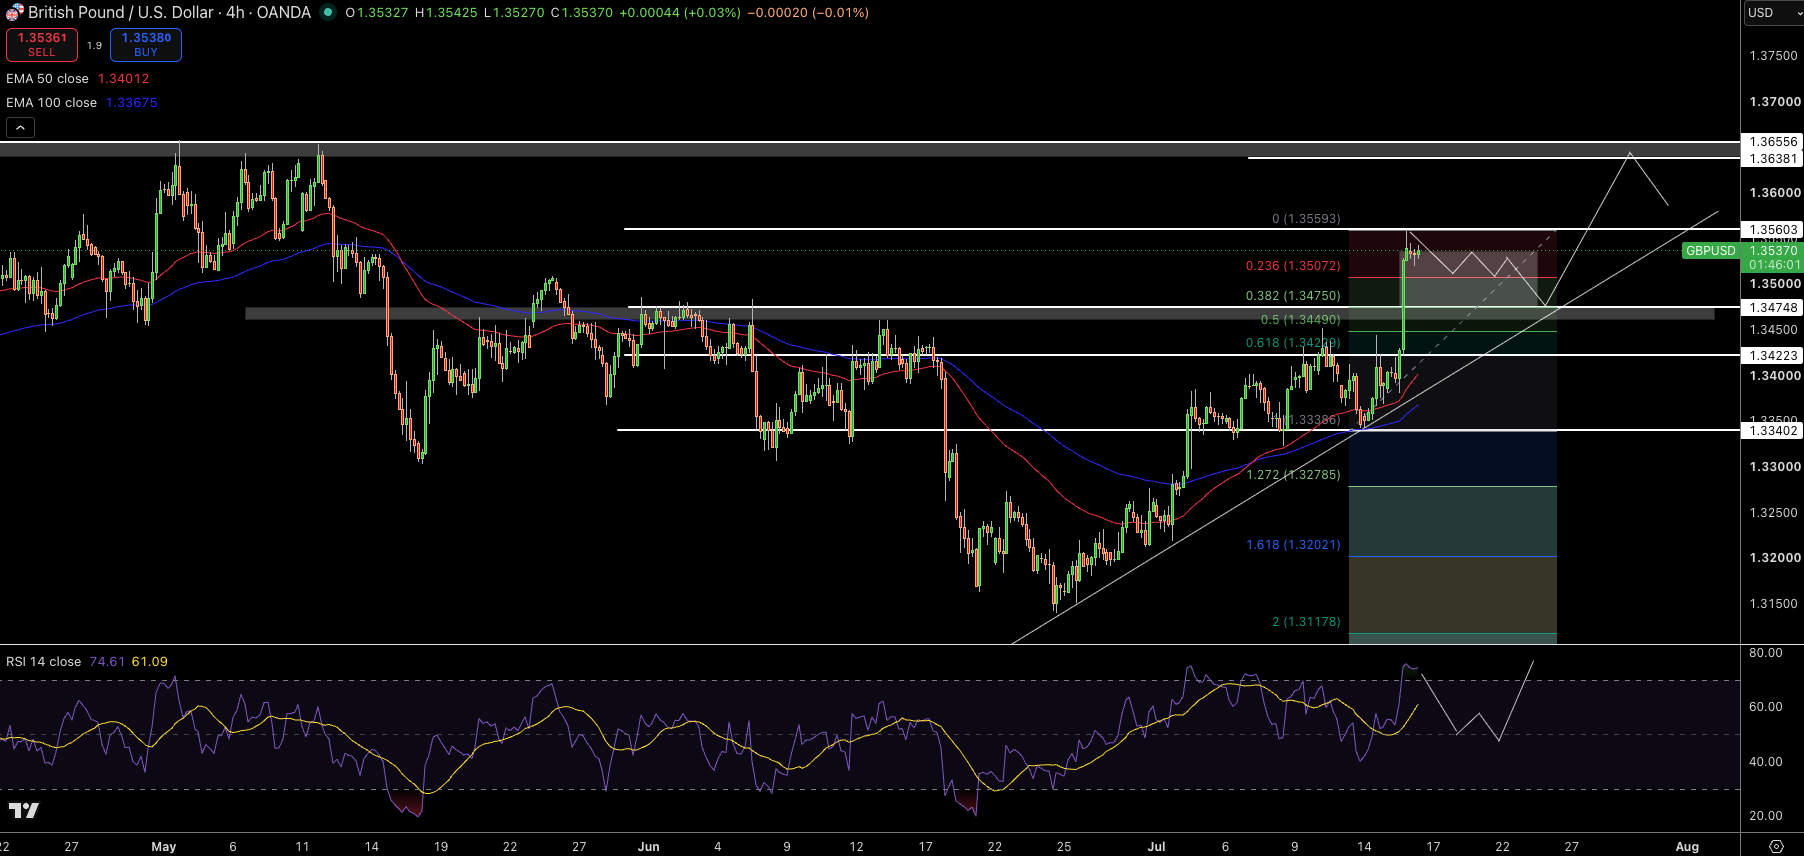
GBP/USD is currently trading at 1.3537, holding above the rising trendline after surpassing the previous swing high. The pair trades higher than the 50-EMA (at 1.3401) and 100-EMA (at 1.3368) as it is clear that buyers still are in a leading position. The recent green candlesticks pushed the pair higher to an intraday high of 1.3559 after minor consolidation, which I would consider as profit-taking rather than a signal of any major trend change.
The 0.236 Fibonacci level at 1.3507 represents support now, with the next level at 1.3475. Resistance levels are at 1.3560 and then 1.3638. RSI at 61 shows the pair remains comfortably bullish and far away from overbought, indicating the room for further bullish momentum remains intact. With this in mind, I would buy when price trades above 1.3507 and target profit at 1.3560, however, if the pair falls below 1.3475, then the pair may retest the support of 1.3449.
GBP/USD Price Forecast
Every new GBP/USD analysis as it publishes, today's technical signal and key levels, live price — on one page.
See all GBP/USD forecastsEUR/USD Technical Analysis: Is the Break Above Triangle Resistance Opening the Door to $1.1493?
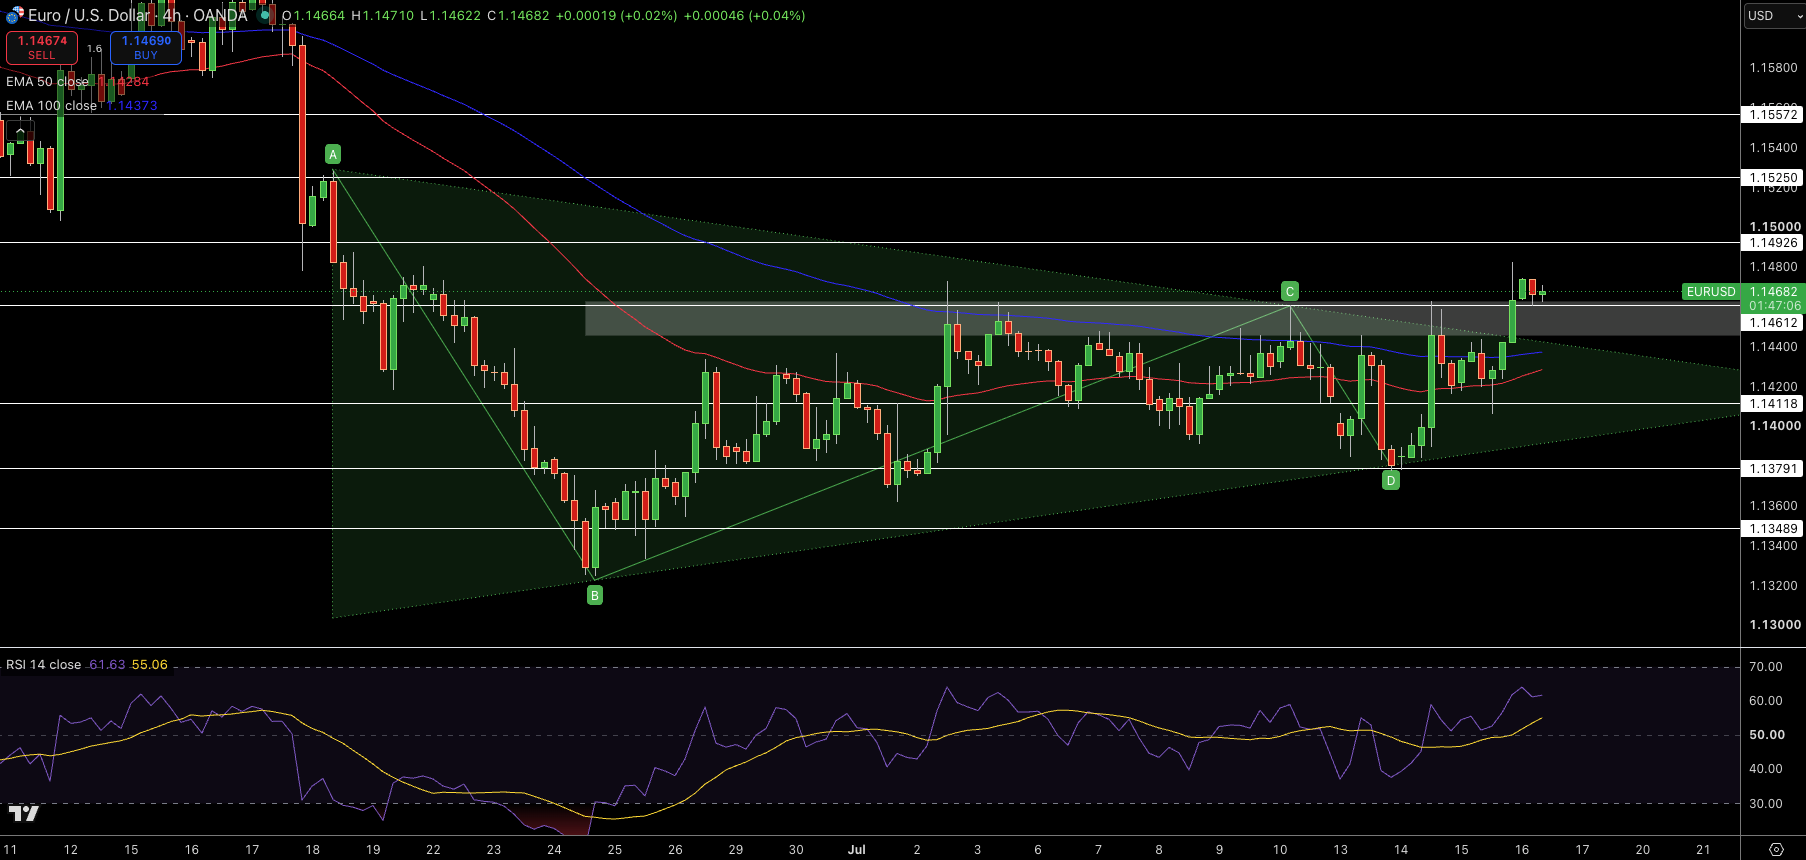
EUR/USD is trading near 1.1468 after breaking out of the trendline to the upside of a descending pattern that has formed a triangle shape and regained the 50-EMA (at 1.1428) and the 100-EMA (at 1.1437). The recent candlesticks have closed higher than the earlier resistance zone near 1.1461, indicating that buyers have stepped in after a period of sideways consolidation.
Resistance at 1.1493 is now in place, with 1.1461 as support initially and then 1.1412 after that. RSI at 61 shows the bullish bias is building strength, however, is not yet considered overbought. With this in mind, I would buy when price trades above 1.1461, aiming at taking profit around 1.1493. But if the pair drops below 1.1412, the pair will become less attractive as a buy.