Gold News: Retail Sales Test Meets Strong Central Bank Demand
Gold and silver fundamentals continue to be supported by strong central bank demand as well as the U.S. retail sales report that will be released this week is a key indicator to consumer spending, which can help determine the pace and rate of the Federal Reserve’s interest rate cuts. Higher-than-expected retail sales would suggest the economy is still very strong, which will make it harder for a potential interest rate cut in the U.S. to materialize later this year, while weaker data could support the prospect of an interest rate cut by the Fed later in the year.
Also, central banks bought a net 41 tonnes of gold during May, as they added to their gold purchases as led by Poland, 18 tonnes, and China, 10 tonnes, according to the latest report by the World Gold Council. Poland has bought 64 tonnes of gold so far this year, and China added 25 tonnes as well, signaling the continued importance of gold diversification to central bank reserves. Silver’s long-term prospects continue to be underpinned by the demand from the solar, electronics and the electrification industries. Also, according to the World Gold Council, 89% of central banks are expected to increase official global gold reserves over the next 12 months.

Gold Technical Analysis: Will $4,020 Hold or Open the Door to $3,962?
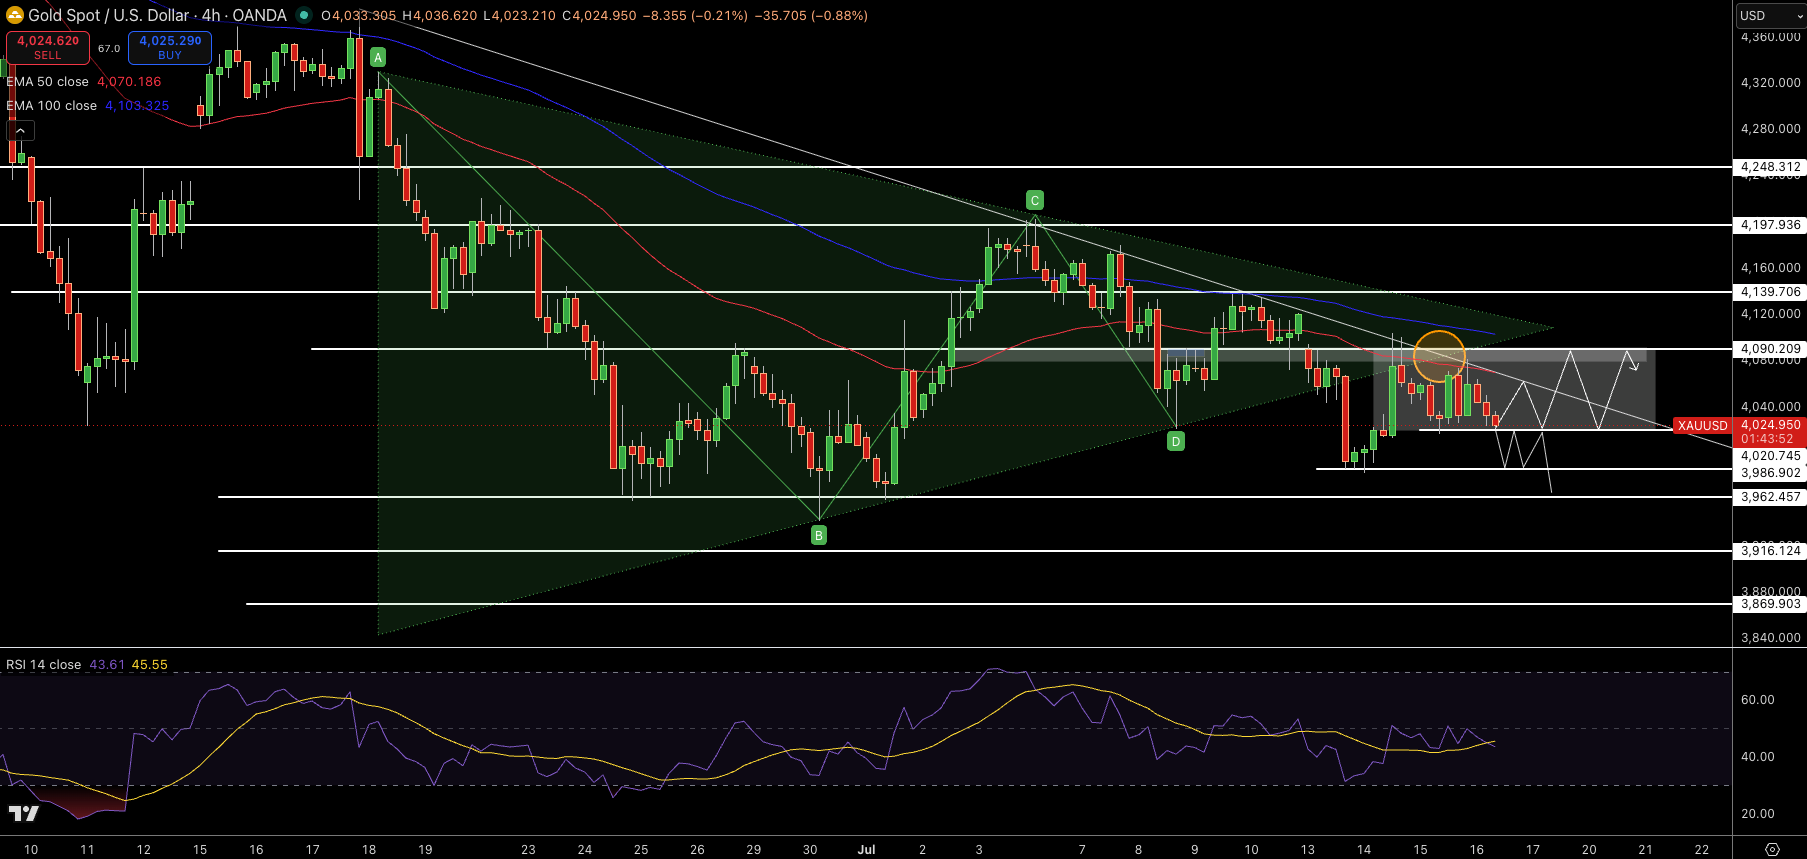
Gold price is trading just under $4,029 on the 4-hour chart, after falling further down below the 50 EMA at $4,070 and staying well below the 100 EMA at $4,103 in the near-term. Recent candlesticks have been printing lower highs and lower lows below the descending trendline, and gold has continued to get rejected by $4,090 again and again, suggesting that sellers are very much in control of the market.
Now, gold price is currently near the $4,020 support area and could fall further down if it falls below this zone towards $3,962. Also, gold’s RSI on the 4-hour chart is hovering near 44, which is still far above the oversold zone, which means that there’s still potential downside for gold price.
However, it should remain stable above the key level for a price recovery back above $4,090 and towards $4,140. Given my analysis, I think that it should trade above $4,090 to target a price at $4,140. However, gold price could break down and trade to a level of $3,962 if it falls below $4,020.
Silver Technical Analysis: Can the Long-Term Demand Zone Stop Another Wave of Selling?
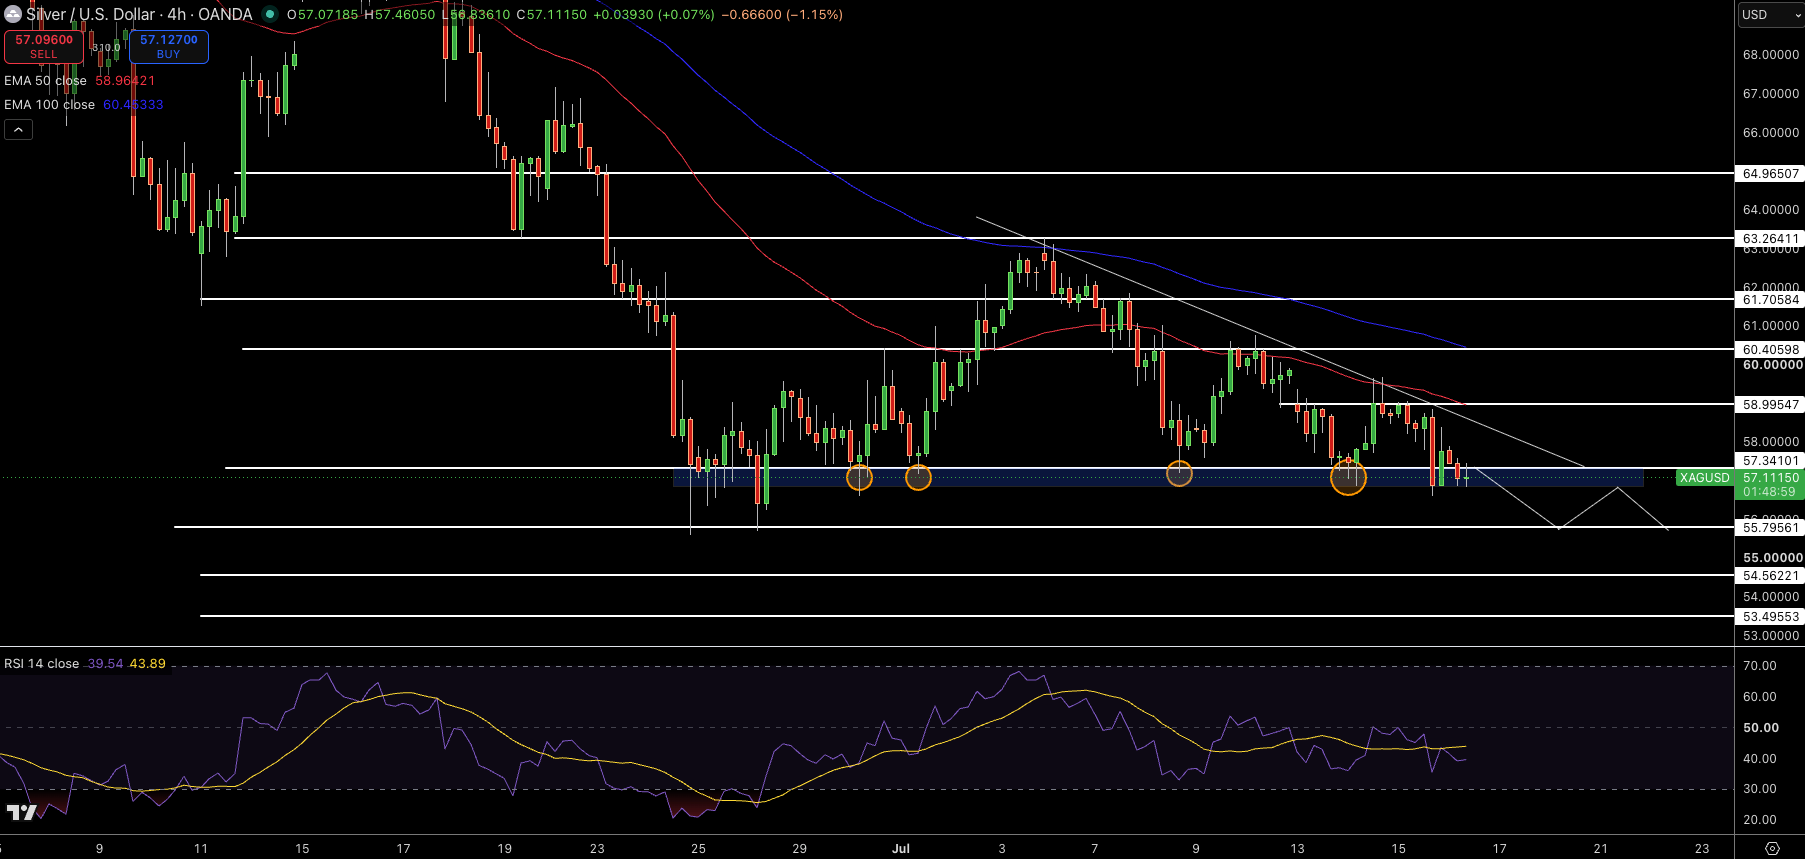
Silver price is trading around $57.10 on the 4-hour chart, after falling back towards a support demand zone of $57.15 in the near-term, as silver price has been repeatedly hitting support at this level in recent weeks. Also, silver is staying below a trendline and the 50 EMA at $58.97, and it’s remaining below the 100 EMA at $60.45, which continues to suggest that sellers are very much in control.
Gold Price Forecast
Every new Gold analysis as it publishes, today's technical signal and key levels, live price — on one page.
See all Gold forecastsRecent candlesticks have been printing smaller candlesticks near the support, and silver price could potentially reverse if it finds support from this zone. Also, silver price could get rejected again by $58.99, followed by $60.41. However, if silver trades to a level below $57.15, it will likely slide to a level near $55.80. In addition, silver price’s RSI on the 4-hour chart is hovering near 39, which is still below the midline, but still in above the oversold zone, which means that there’s still potential downside for silver price.
However, I think that it should stay above $58.99 to target a price at $60.41, and it should fall down to trade at a level of $55.80 if it breaks down below $57.15.