
Oil News: OPEC Demand Cut Meets Rising LNG Uncertainty
After the Middle East crisis resurfaced, OPEC and the International Energy Agency (IEA) changed their oil demand and supply assessments. OPEC, the Organization of the Petroleum Exporting Countries, slashed its oil demand growth forecast for 2026 to 780,000 barrels per day, its third consecutive downgrade. The group says the world is set to consume 1.94 million bpd more in 2027 once geopolitical tensions deescalate.
Global crude output by OPEC and its allies climbed to 36.28 million bpd in June as Gulf Arab members gradually increased production. Global oil supply rose by 4.1 million bpd in June to reach 98.8 million bpd, though oil production still trails pre-war figures by 9.4 million barrels daily, IEA data shows. The world accumulated 21 million barrels of crude this month, with shipments improving as shipping across the Hormuz Strait resumed on a partial basis.
Oil supply is constrained while the IEA forecasts global gas demand dropping 0.5% in 2026 as LNG shipping remains in a lull following disruption of Hormuz, which shipped 20% of the world’s LNG shipments, though there have been encouraging signs of increased tanker transits since the June ceasefire agreement.

Natural Gas Technical Analysis: Will the Range Finally Break Below $2.85 or Recover Above $2.94?
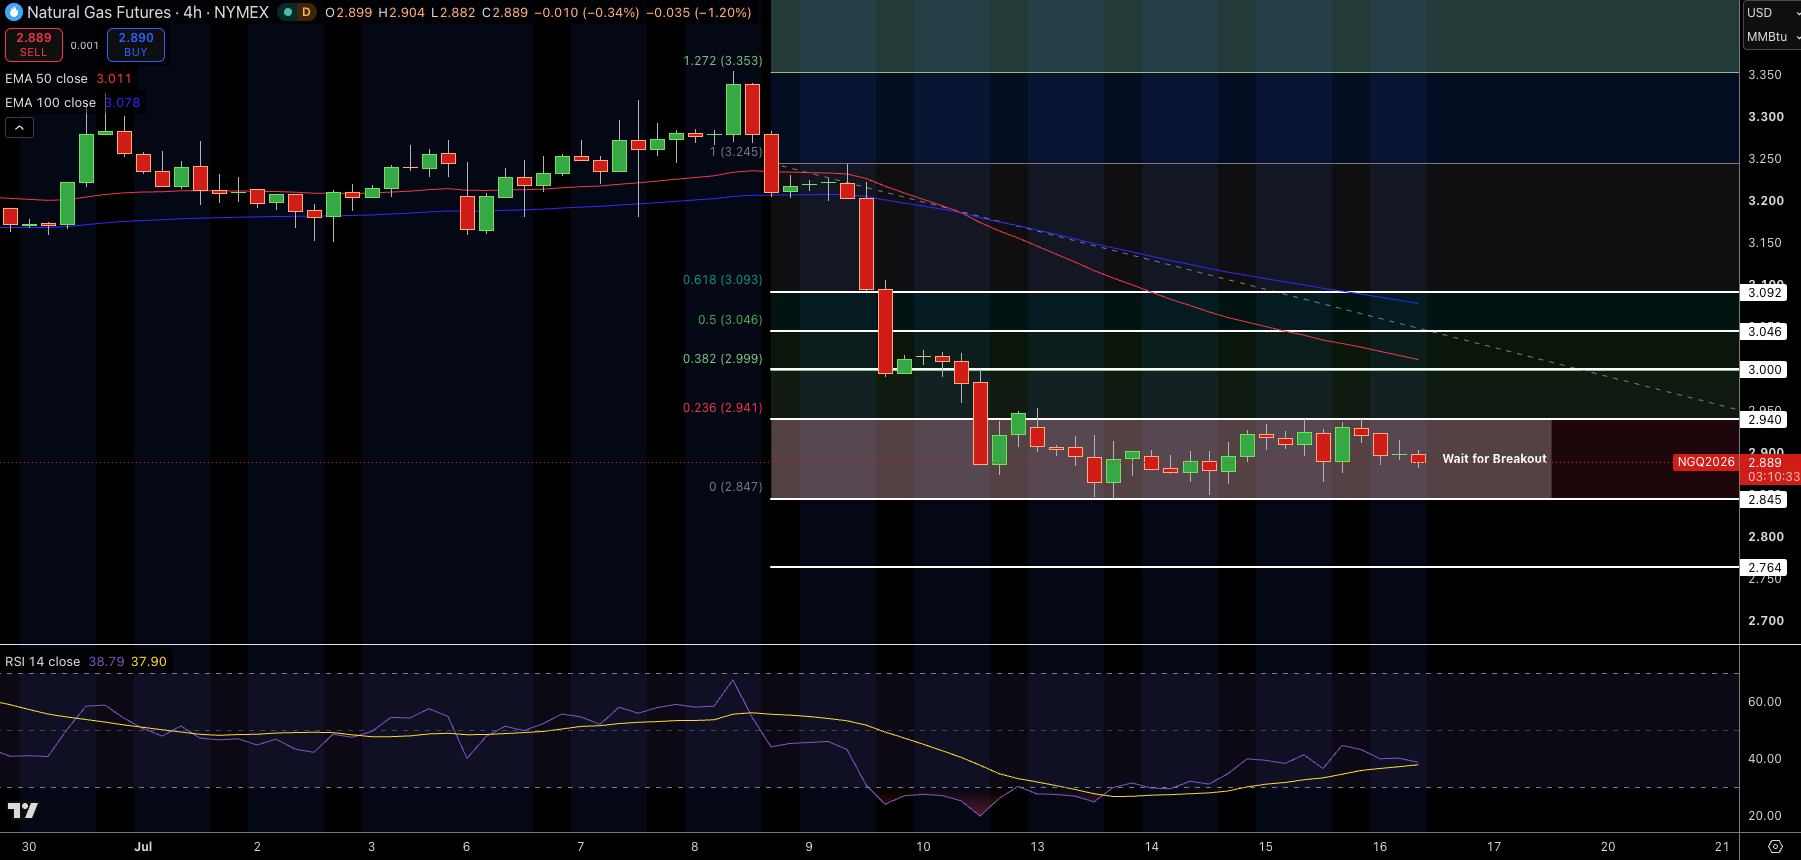
Natural gas is trading at $2.89; the price has been stuck within a tight range between $2.85 support and $2.94 resistance. The price action of late has shown small candlesticks, indicating uncertainty from both buyers and sellers. Natural gas continues to be held back by a descending trendline, and 50 ema ($3.01) and 100 ema ($3.08) continue to provide resistance. $2.94 is the first resistance level, with $2.85 holding up as important support level.
RSI is at 39, in a negative range but not yet oversold, indicating some momentum but still in the hands of the sellers. In my opinion, I’ll go long once we break out of $2.94 to target $3.00, while a break below $2.85 will target $2.76.
Natural Gas Price Forecast
Every new Natural Gas analysis as it publishes, today's technical signal and key levels, live price — on one page.
See all Natural Gas forecastsWTI Crude Oil Technical Analysis: Can Buyers Clear $80.17 for the Next Leg Higher?
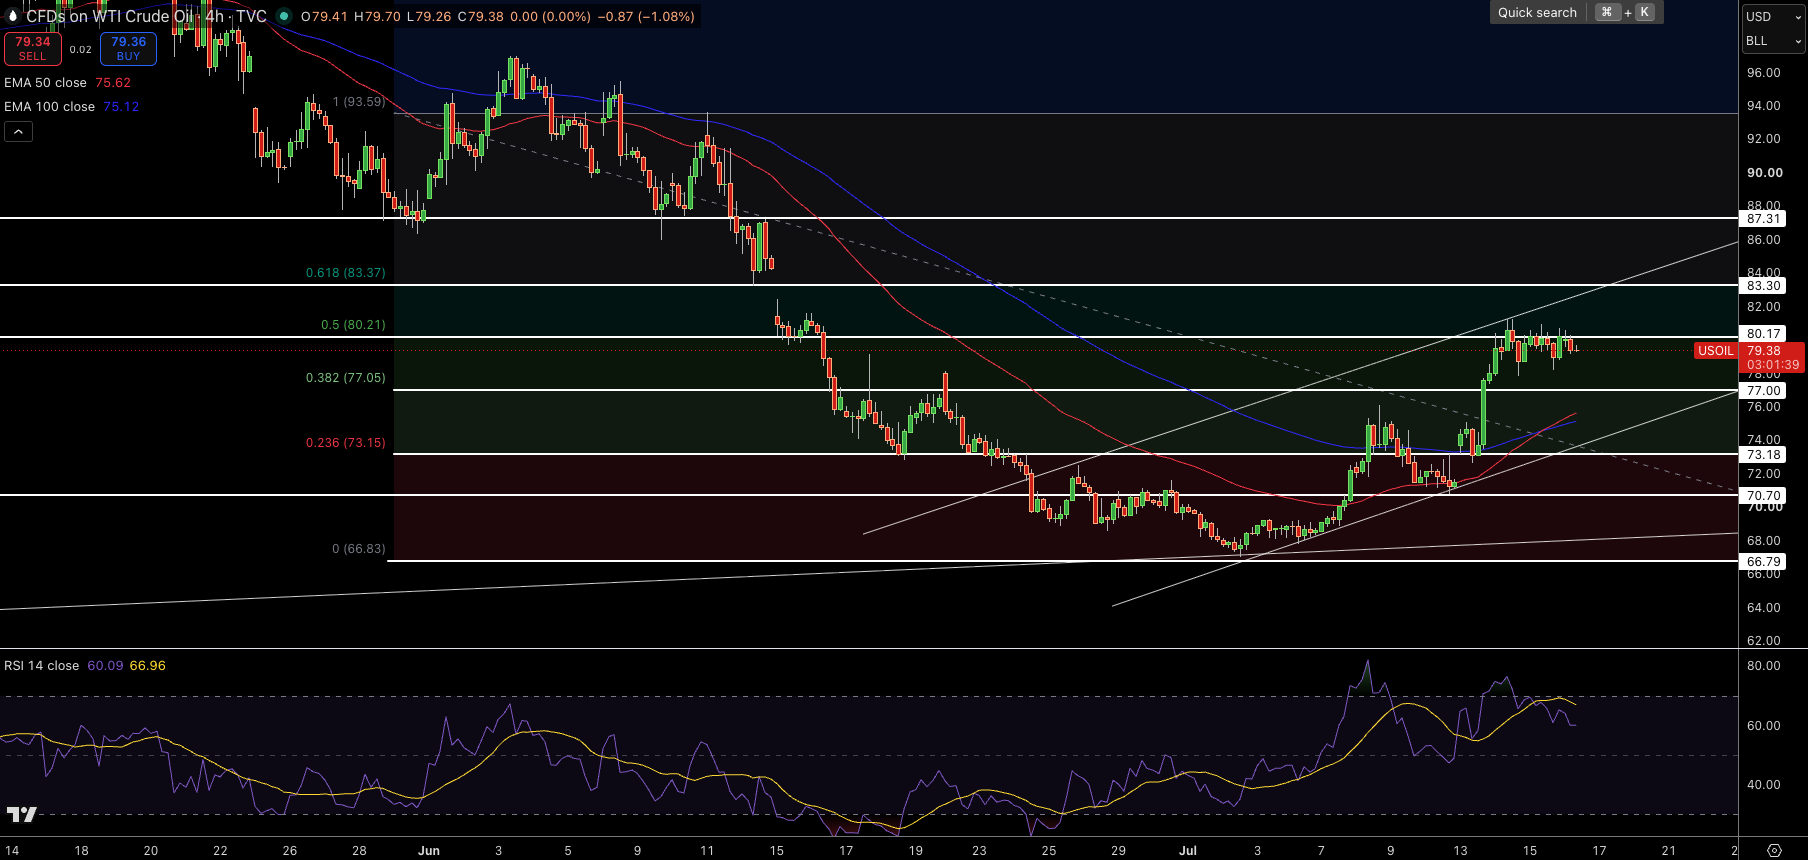
WTI crude is trading at roughly $79.38, following a strong rally from $66.83 low. The price is currently finding it hard to climb above $80.17 resistance area. The price action of late shows small candlesticks with long wicks, indicating a period of uncertainty following a strong move. WTI crude continues to stay on a rising trendline, with the 50 ema ($75.62) and 100 ema ($75.12) both providing support.
The 0.382 Fib level at $77.05 is the first support level; the next support is at $73.15. A move above $80.17 will target the 0.618 Fib level at $83.37. RSI is hovering around 60, having eased off from an overbought condition. In my opinion, I’ll only go long at a breakout of $80.17 with a target at $83.37, while a break below $77.05 would weaken this structure.
Brent Crude Oil Technical Analysis: Is the Pullback Above $84 Just a Pause Before $87.34?
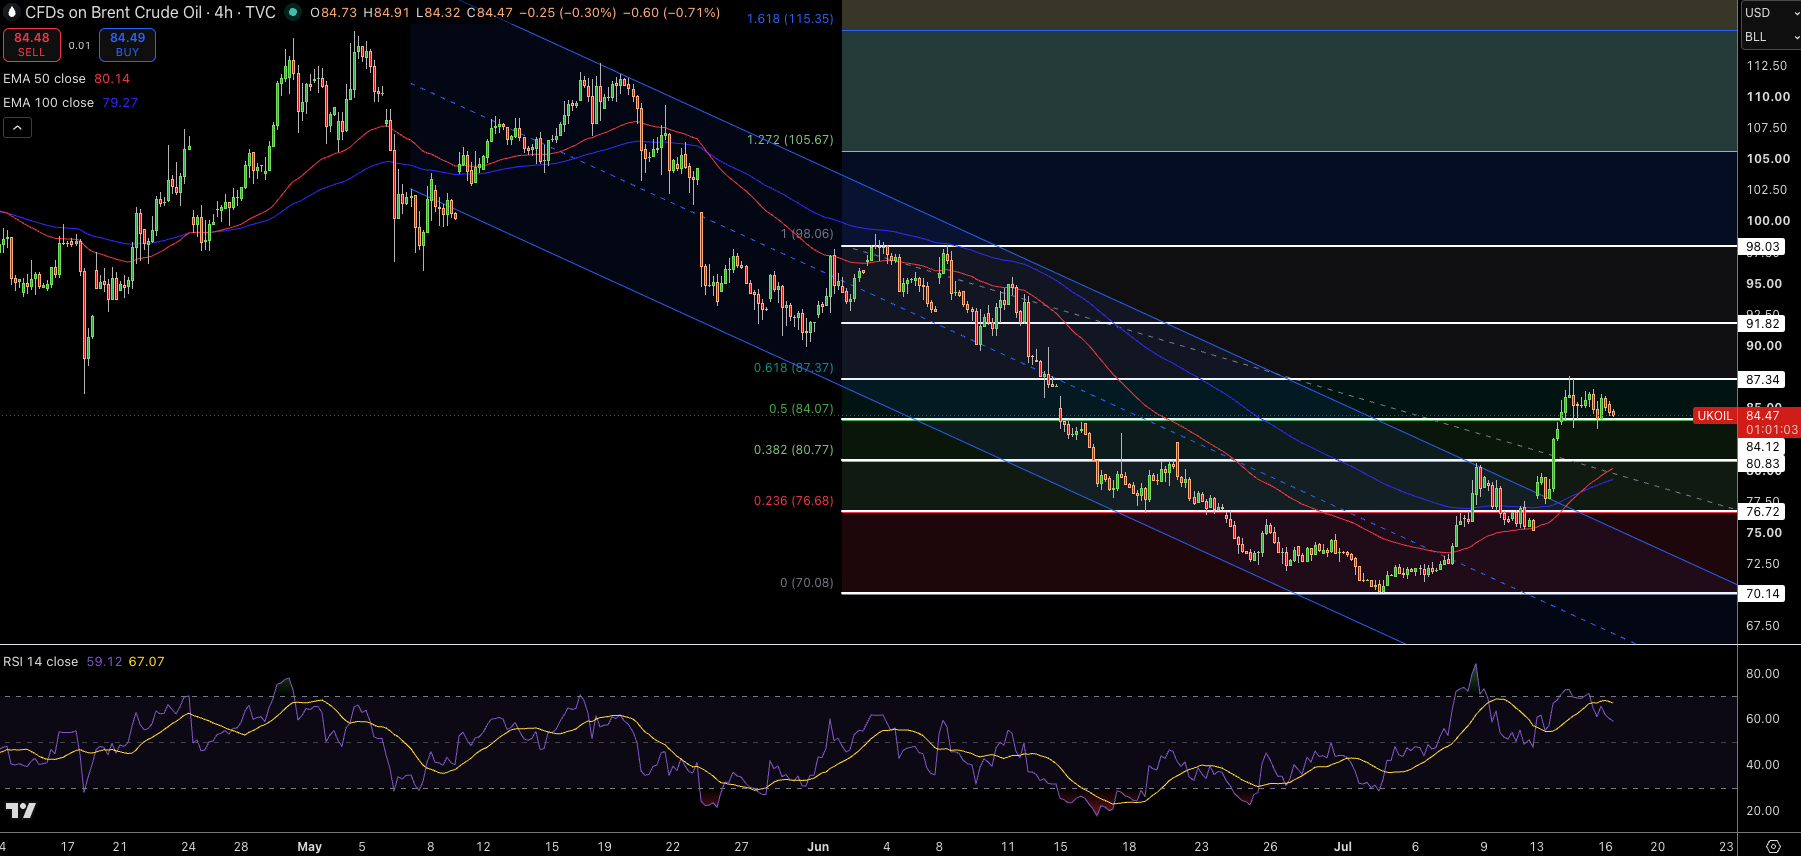
Brent crude is trading around $84.47, after a breakout in a longer term down trending channel, taking out 0.50 Fib level at $84.07 price area. The price action over the last few days has continued to consolidate just above the price area it broke, but buyers have defended the price levels against short term profit taking. Price is comfortably above 50 ema ($80.14) and 100 ema ($79.27), which supports the trend structure. $84.07 is the first support level, next support at $80.83.
Resistance is at $87.34. RSI is at 59, still a bullish range, but has softened and indicates reduced momentum, but not a reversal. In my view, I’ll go long as long as we stay above $84.07 Fib support to target $87.34, whereas a break below $80.83 would neutralise the bullish view.