Momentum Weakens as Cisco Tests Key Support
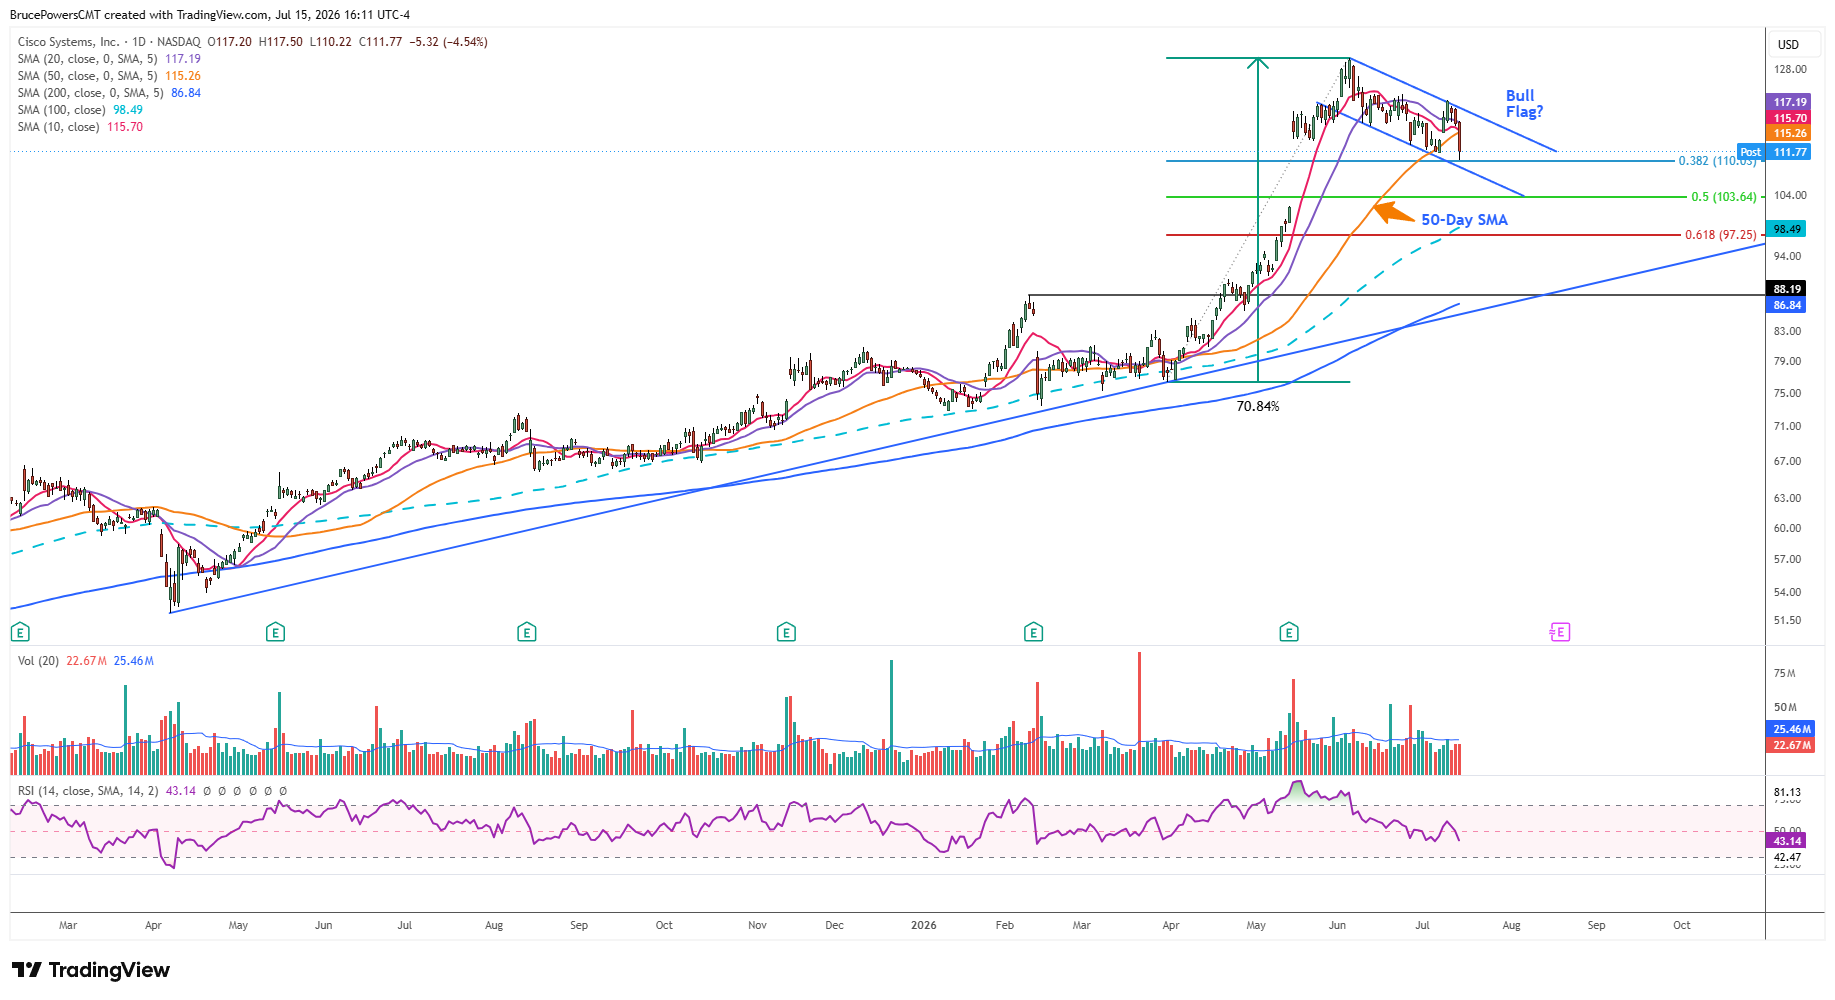
The stock of Cisco Systems, Inc. (CSCO) reached a peak of $130.37 in early-June, completing a 70.8% advance from its prior swing low in late March. It has been in corrective mode since, reaching a new retracement low of $110.22 on Wednesday and testing support near the 38.2% Fibonacci retracement at $109.72 for the second time this month.
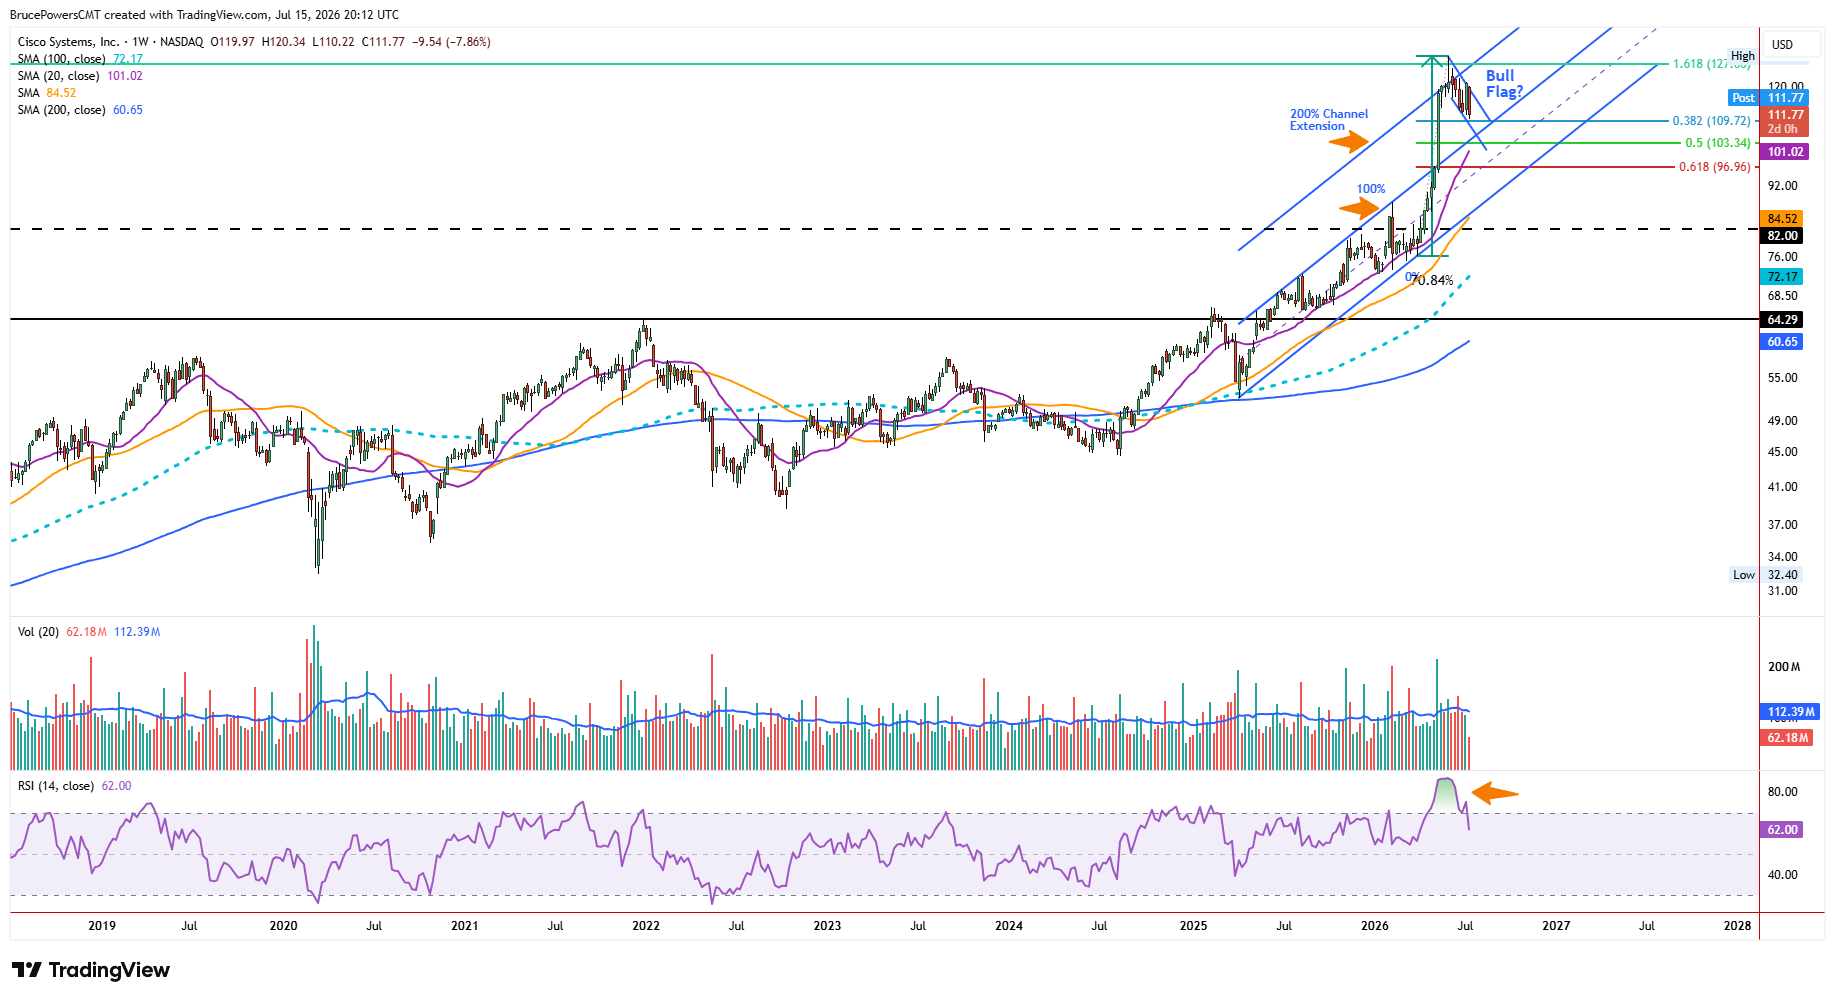
In addition to establishing a new pullback low, CSCO broke decisively below the 50-day moving average, which was been confirmed as support at the beginning of the month. Meanwhile, the weekly Relative Strength Index (RSI) dropped below 70, moving out of overbought territory. Those signs of weakening momentum suggest the correction may not yet be complete, making the current support test particularly important.
The June peak followed a breakaway gap higher from a rising trend channel in response to the company’s earnings report on May 13. The strong rally followed a multi-year base breakout that began in early June 2025. Resistance near the June peak was validated by the completion of a 161.8% Fibonacci extension of the bearish correction that began after the April 2000 peak of $82.00. Moreover, the June monthly candlestick formed a bearish shooting star pattern, which was confirmed in July when the price fell below $112.86.

Key Downside Levels to Watch
The continuation of the bearish correction suggests that lower support levels may be tested before the correction is complete. If support fails to hold near the 38.2% Fibonacci level, the 50% retracement at $103.34 becomes the next downside target. That area may soon be joined by the rising 20-week moving average, adding to its potential significance. In addition, the upper boundary line of the original rising trend channel is near the 50% retracement zone. Since it has not yet been tested as support following the May channel breakout, there is a good chance that it will be tested before demand begins to recover.
Bullish Flag Holds the Key
During the pullback, CSCO has formed a potential bullish flag pattern bounded by two parallel declining trendlines. The lower boundary line defines dynamic support, and given the structure of the formation, the 50% retracement level may be reached while maintaining the integrity of the potential bullish flag pattern. However, if support fails at the lower flag boundary, it would signal more significant selling pressure and further deterioration of the potentially bullish pattern.
Whether buyers can successfully defend support near the current Fibonacci retracement or the deeper 50% retracement zone will likely determine if this pullback ultimately proves to be a healthy correction within a longer-term uptrend or the start of a more significant corrective phase.
If you’d like to know more about technical analysis and how traders use it, please visit our educational area.