AMD Technical Analysis
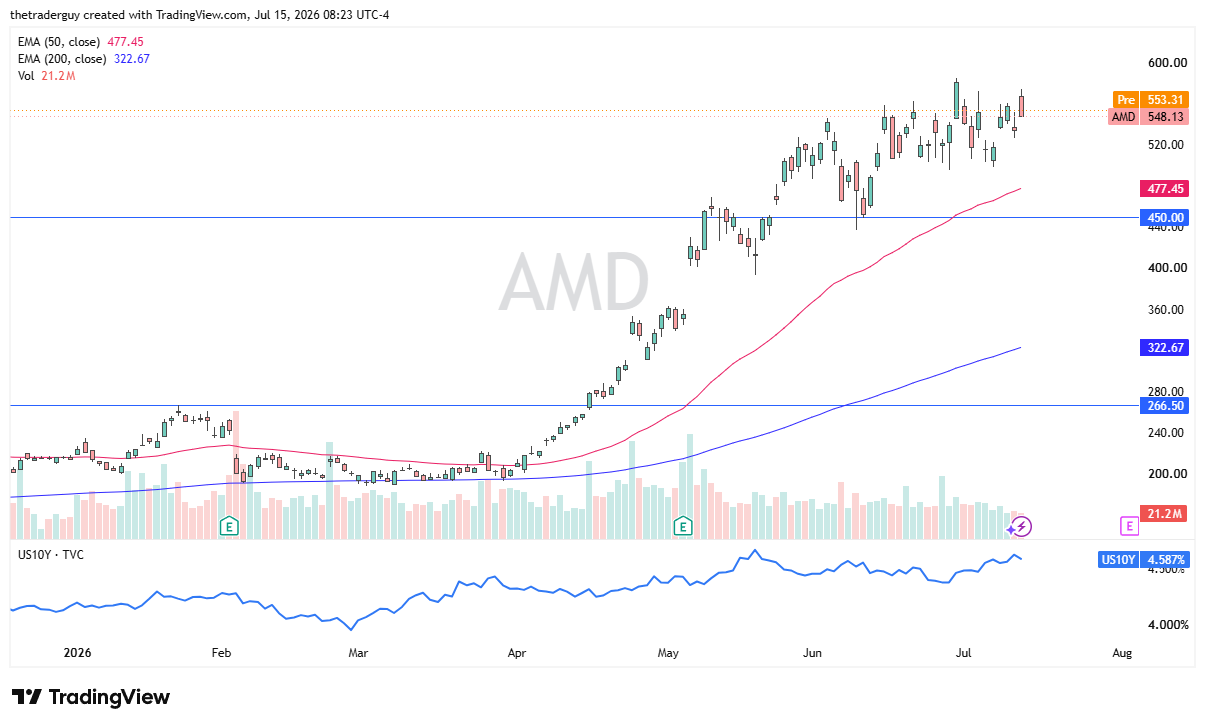
Advanced Micro Devices looks like it is going to try to recover a bit, as we had on Tuesday, gapped higher and then fell to fill that gap. Now it looks like we are trying to turn right back around to show signs of life again. AMD has been in an uptrend for quite some time, and currently, it looks as if it is trying to continue that uptrend despite the fact that there is a lot of noise out there when it comes to artificial intelligence and the market that is around it. Overall, AMD looks like a market that is very well aware of the $600 level, above which offers a bit of resistance. It looks like it is a buy on the dip market based on the price action, as we have seen buyers continue to come back.

NVDA Technical Analysis
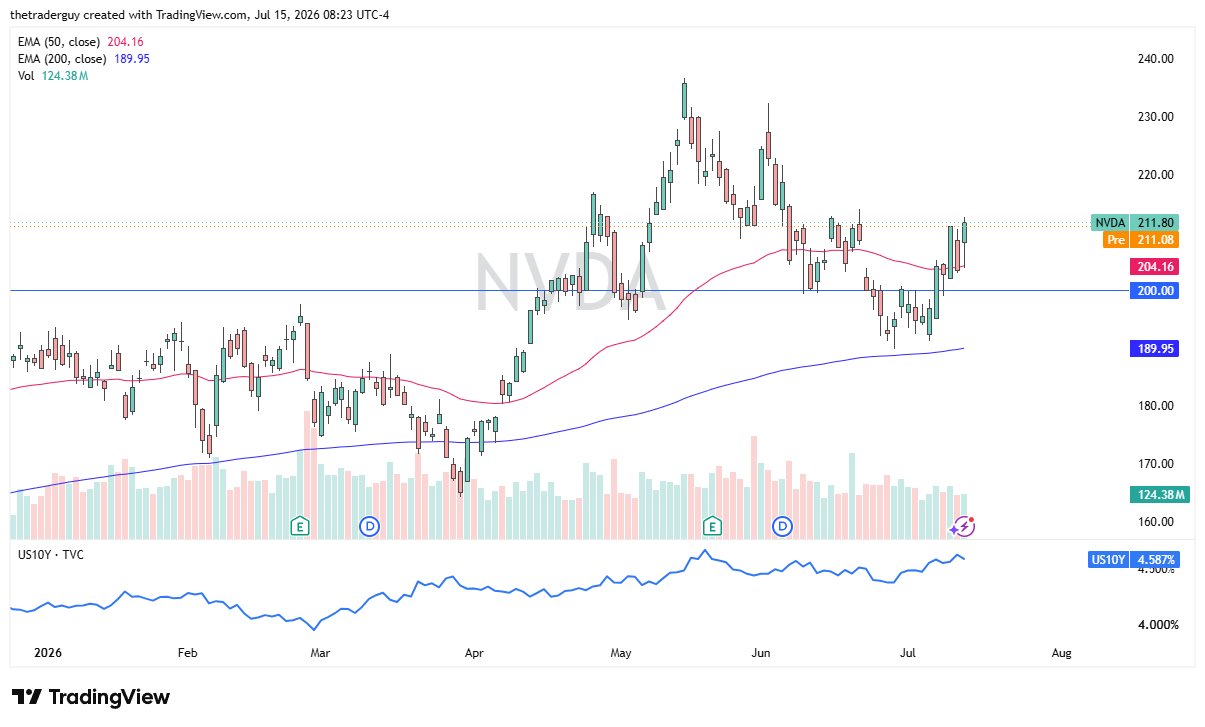
NVIDIA looks like it is going to be a little bit soft on the open, but the price action on Tuesday was very strong as it initially started falling, bounced from the 50-day EMA, and then took out the highs from the Monday session. The dip in pre-market trading is very minor; it will be interesting to see how this plays out. It does look like there are plenty of buyers in this neighborhood who will be interested in getting involved in this market. Interest rates are starting to roll over a little bit as we head into New York trading, so we will have to see if that has an influence. NVIDIA has done quite a bit of movement over the last couple of weeks, and it certainly looks like it is trying to fight back.
INTC Technical Analysis
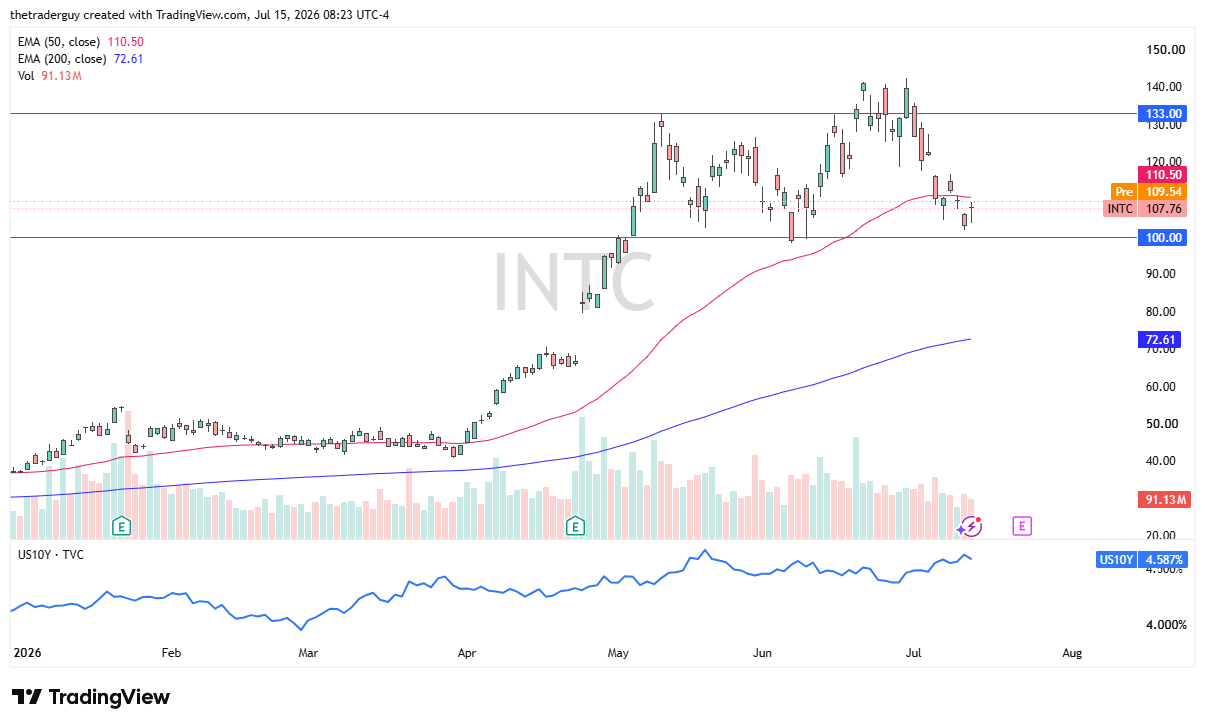
Intel looks like it is going to gap up a little bit, testing the 50-day EMA, but more importantly, bouncing from the $100 level, an area that has been important more than once. If the market can continue to go higher, the top of the consolidation can be found near the $133 level. In general, microchips tend to move as a sector so it will be interesting to see if there is any knock-on effect here.
Intel has been one of the better performers in the sector over the last several months, until recently, when most of them went into consolidation. This, of course, will continue to be a market that I think a lot of people watch because it made so many headlines early in the year. $100 makes sense as a psychologically important support level.
If you’d like to know more about technical analysis and how traders use it, please visit our educational area.