Bitcoin (BTC) has gone up by 3% in the past 24 hours after yesterday’s lower-than-expected inflation print in the United States.
The top crypto has managed to stay above the $60,000 threshold these days, keeping a couple of high time frame (HFT) buy signals in play even though volatility persists.
On Tuesday, the Bureau of Labor Statistics published its inflation report covering June. According to its data, prices in the North American country retreated by 0.4% compared to a month ago.
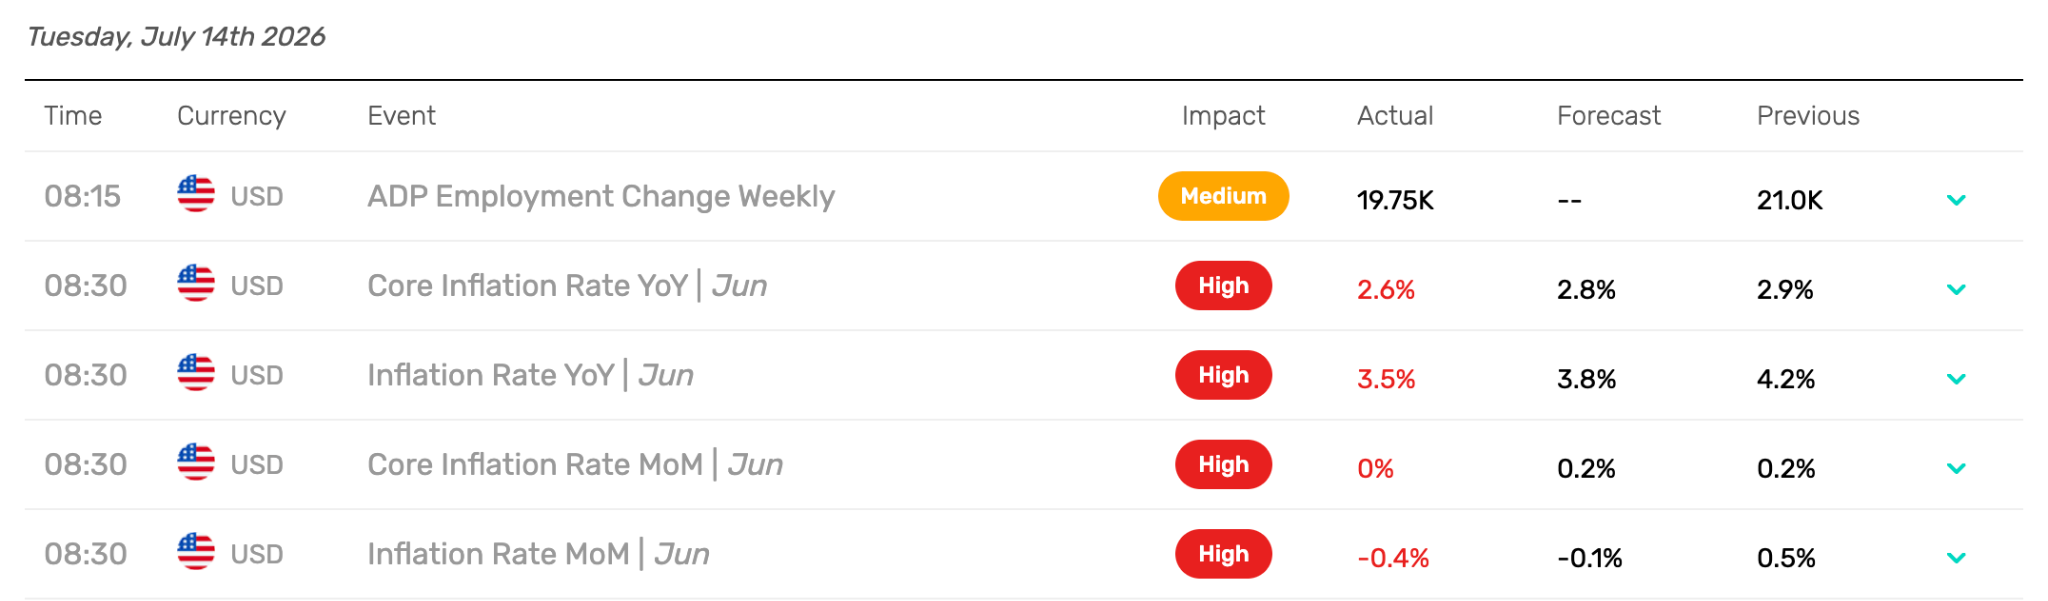
Meanwhile, core inflation in the last 12 months, which excludes food and energy costs, rose by 2.6%, or 20 basis points below the market’s estimates for the period.
This was perhaps the main cause for yesterday’s rally, as it indicates that inflation is cooling down in the country despite President Donald Trump’s aggressive tariff increases and persistent tensions in the Middle East.
Despite this uptick, Bitcoin ETFs did not fully capture the market’s excitement, as only $180 million was deposited into these vehicles, lowering this week’s net outflows to -$244 million.
The crypto market continues to be cautious regarding Bitcoin’s price action as we are still in consolidation mode. However, two bullish patterns continue to hold up, and their bias could be confirmed if the price manages to break some specific long-dated resistances.

Bullish Weekly Signal Favors a Long-Term Target of $200K for Bitcoin
Heading to the weekly chart, a powerful buy signal that has yielded impressive results three times in the past 11 years continues to be in play as BTC bounced off its cycle low of $60,000 recently.
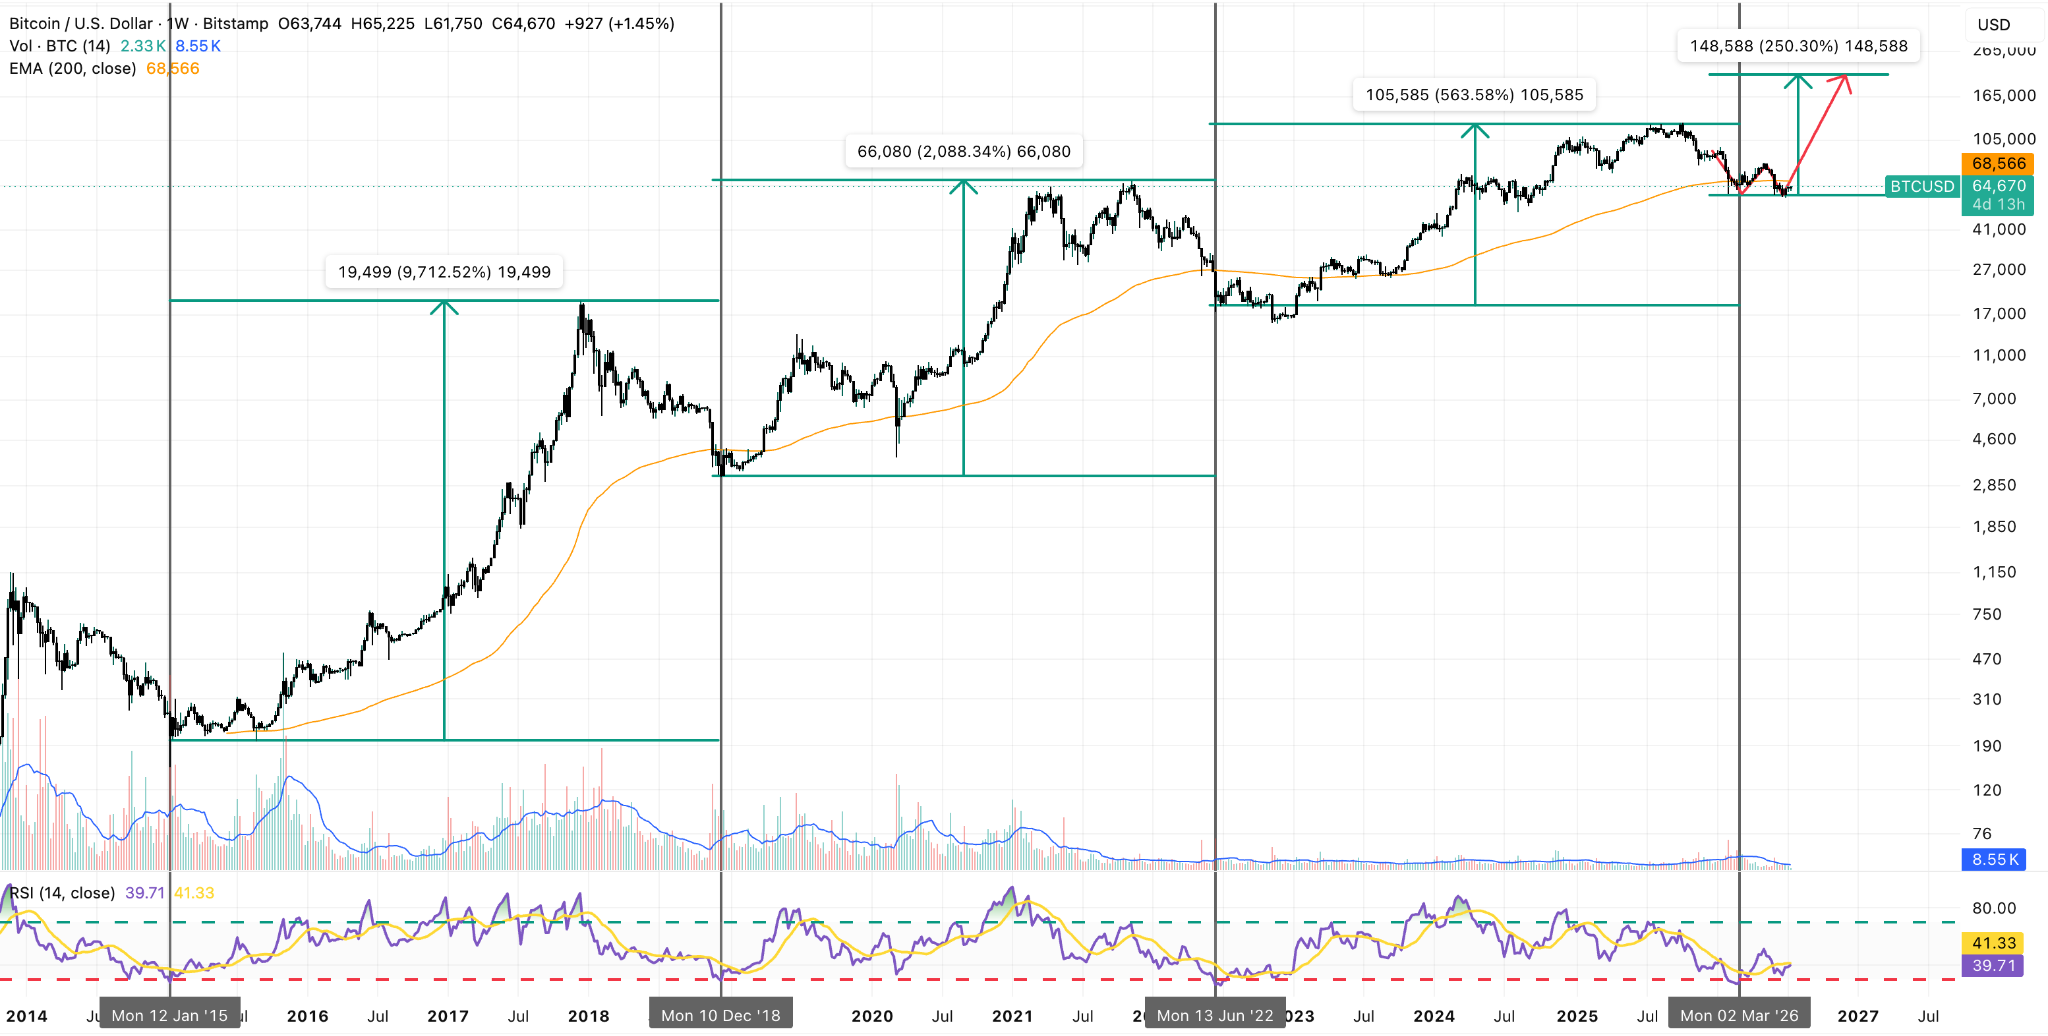
Based on this historical pattern, Bitcoin has been a buy every time the Relative Strength Index (RSI) dips below 30 in this higher time frame.
In two out of three occasions, BTC has stood above the previous cycle low and has rallied to a new all-time high 6 to 12 months later.
Meanwhile, there’s a 33% chance that the top crypto will drop to a lower area, which we think could be the $50K level, before that strong rally commences.
For now, the odds favor a sustained uptrend that could ultimately push BTC to $200,000 in the long term. To confirm the pattern’s bullish bias, we would like to see BTC rising past $80,000, as this is the neckline of a W-shaped bullish setup that has formed in the weekly chart.
Bitcoin Price Forecast
Every new Bitcoin analysis as it publishes, today's technical signal and key levels, live price — on one page.
See all Bitcoin forecastsLiquidations Spike But BTC Still Needs to Climb Above $66K to Flush Bears Out
Short liquidations spiked to $300 million yesterday as a result of the move, primarily fueled by Ethereum’s climb above $1,800.
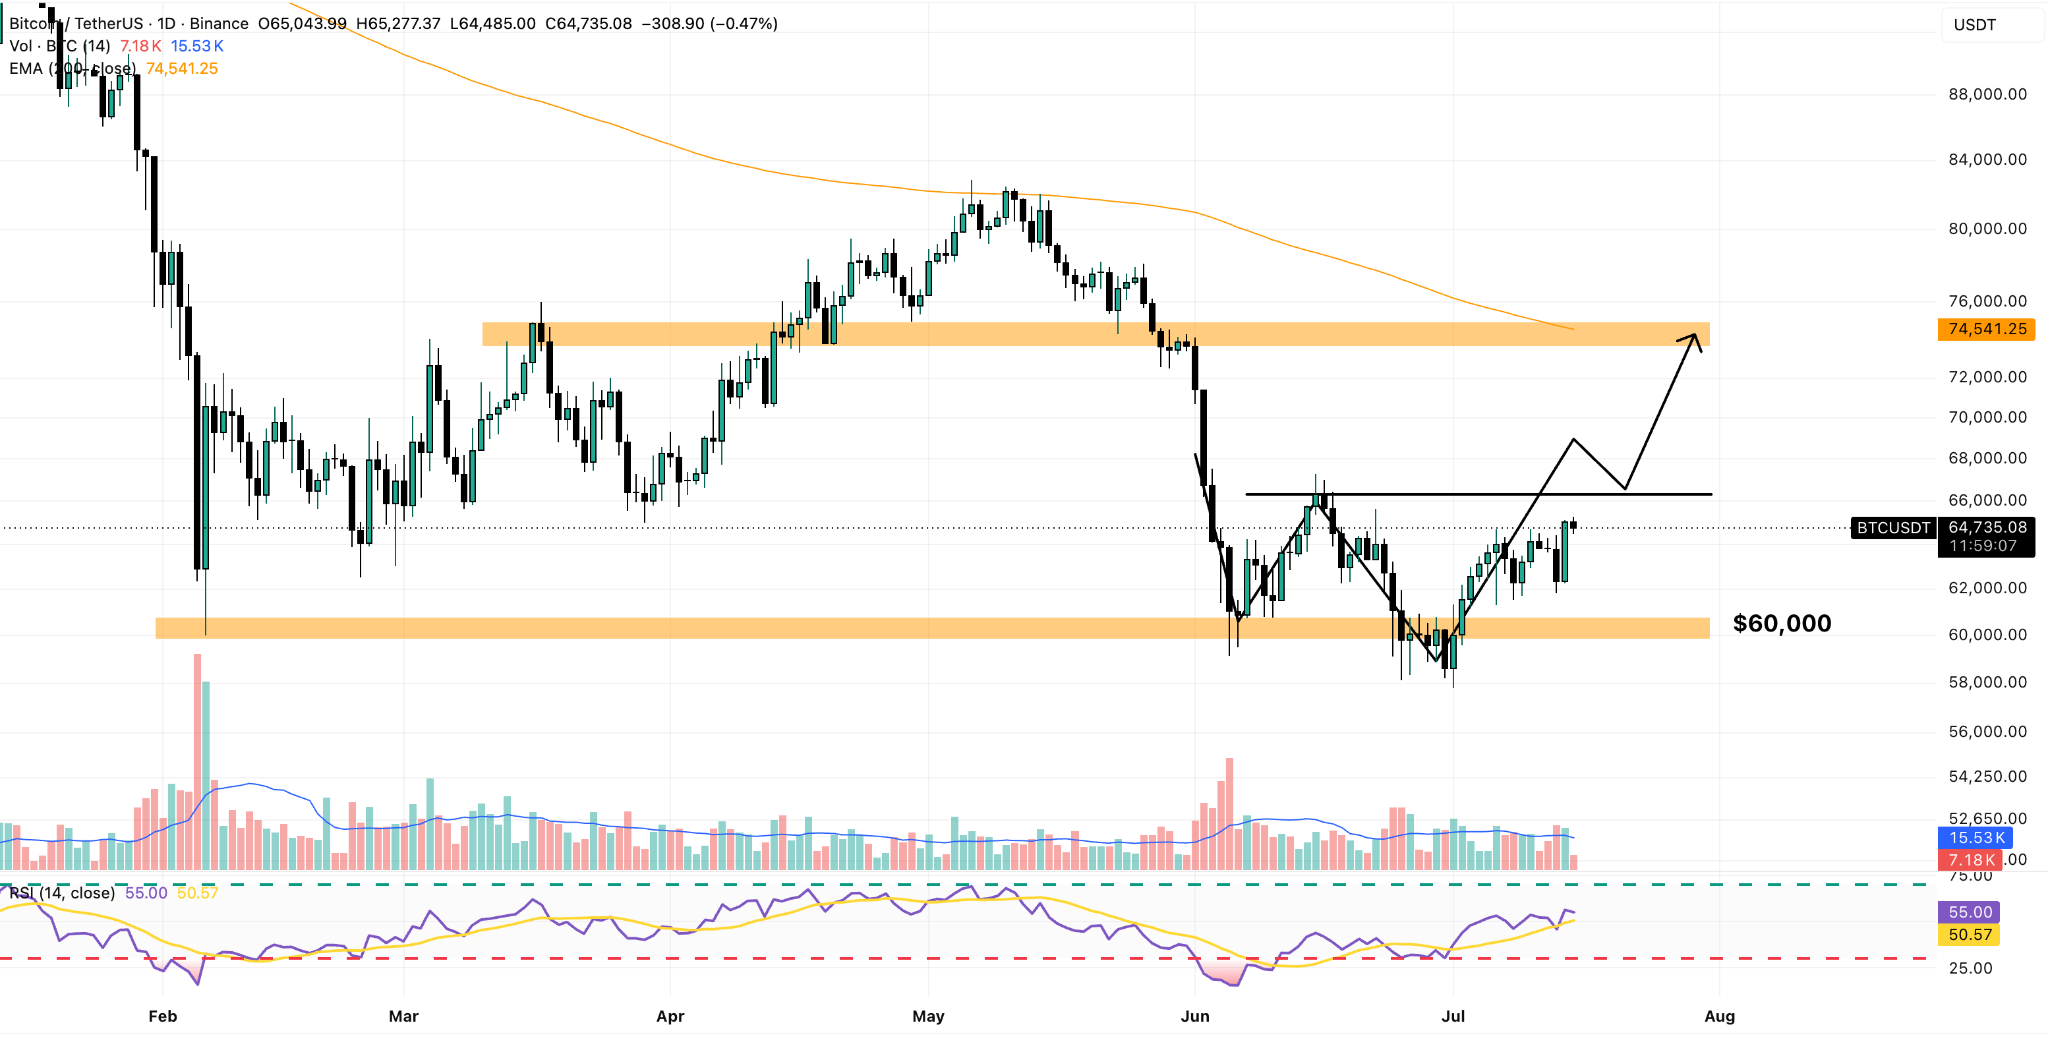
For BTC to rally toward its 200-day exponential moving average (EMA) at around $74,000, which is our near-term target for the token, the price has to first climb above $66,000.
This is the neckline of a W-shaped bullish pattern that has formed in this daily time frame. This setup is also a fractal of the weekly “W” mentioned earlier, which makes it a high-probability trade if confirmed.