Soft PPI Lifts Gold but Oil Holds the Ceiling
Gold caught a bid on the soft June PPI but the rally ran out of conviction almost immediately. The report gave buyers a reason to step in and they did, but the conversation shifted back to crude oil before the move had room to develop. June inflation data is backward-looking and oil is repricing the forward inflation picture in real time. That mismatch is why gold cannot hold a rally on a number the market has already moved past.
Spot Gold (XAUUSD) is trading $4059.39 at 13:34 GMT, up $6.61 or +0.16%.
June’s Inflation Is Already Stale and Warsh Knows It
The PPI added to Tuesday’s soft CPI and confirmed inflation was trending the right direction during June. Wholesale prices fell 0.3% with gasoline plunging 12% and accounting for two-thirds of the monthly decline. Core PPI was slightly cooler than expected. Two soft inflation reports in two days and gold still could not sustain a move because the June data landed in a market that has already moved on.
Iran shut the Strait of Hormuz after those numbers were collected. The U.S. reimposed a naval blockade on Iranian ports, and crude climbed back toward one-month highs. Meanwhile, the gasoline decline that drove the soft PPI is already reversing at the pump. Traders may have bought the number Wednesday morning and are now spending the rest of the session talking about whether August CPI prints hotter.
Higher crude, gasoline, and diesel prices right now raise the risk of hotter readings in the next round of data, and Fed Chair Kevin Warsh is not waiting around to find out. His testimony Wednesday made the central bank’s position clear. “No tolerance for persistently elevated inflation” is not language that softens because one month of wholesale prices came in light. Warsh is watching where inflation is headed, not where it was in June, and crude climbing on Middle East supply disruptions is pointing him toward hawkish, not dovish.
Oil Is Writing Gold’s Next Move
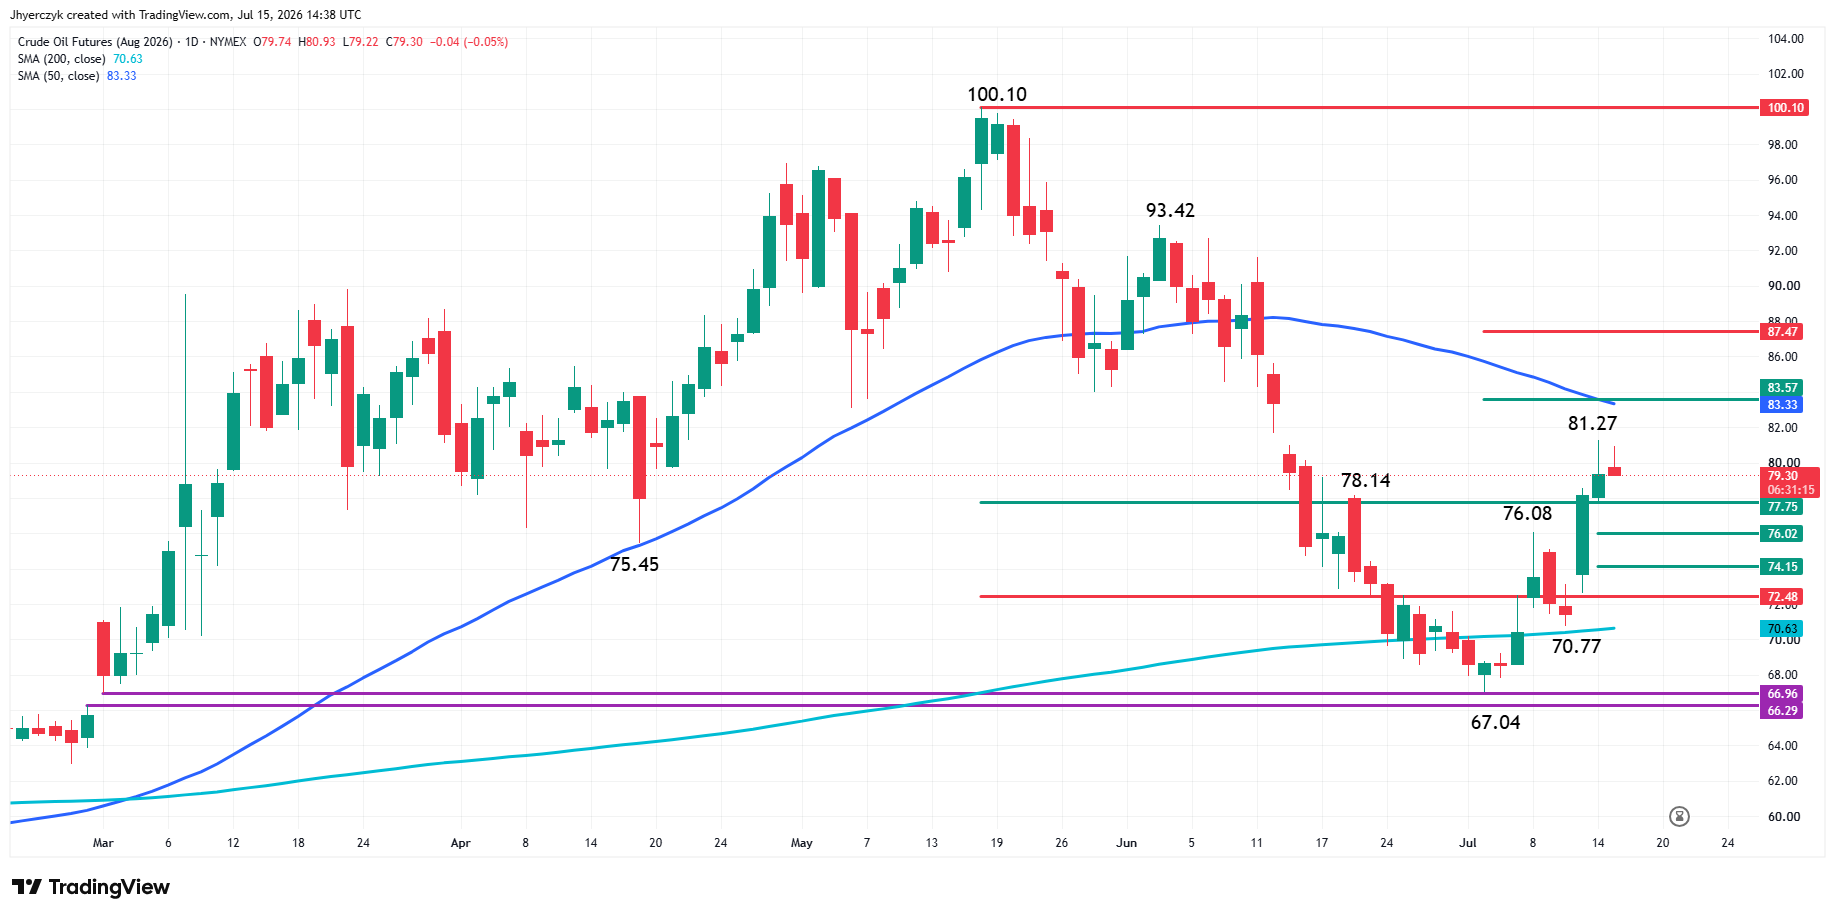
Gold is caught between two forces and the one with momentum is working against the bid. Soft inflation data argues for fewer rate hikes, eventually lower real yields, and higher gold prices down the road. But crude climbing on Hormuz supply disruptions argues inflation reaccelerates this summer, keeps the Fed restrictive longer than anyone positioned for in June, and caps gold right here.
Gold Price Forecast
Every new Gold analysis as it publishes, today's technical signal and key levels, live price — on one page.
See all Gold forecasts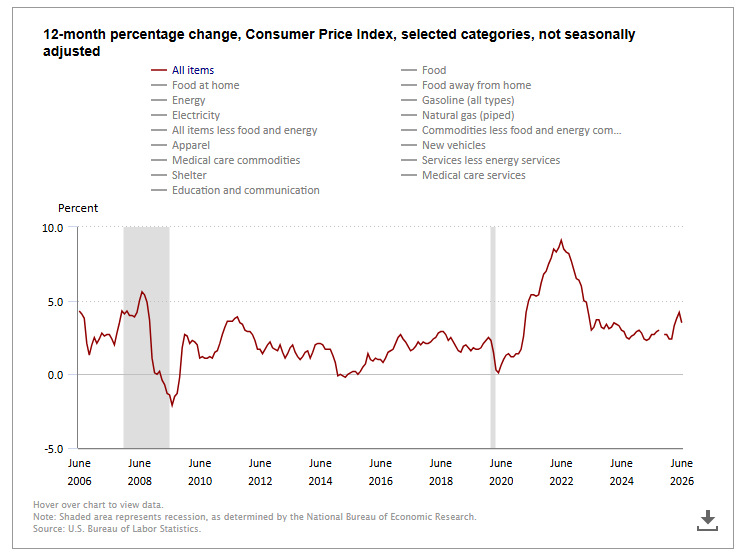
The market spent a few minutes on the PPI celebration and then spent the rest of Wednesday focused on crude, shipping lanes, and what the escalation means for August CPI. That shift tells you where institutional attention sits right now, and it is not on a backward-looking wholesale price report. I think the oil story holds the market’s attention until something breaks the pattern, either crude pulling back on a de-escalation or Brent pushing past $90 and forcing the Fed’s hand on the next meeting.
The second scenario has the momentum. If crude keeps climbing, inflation expectations move with it, Treasury yields stay elevated, and gold goes back to pressing its lows regardless of how soft June looked on paper. If crude pulls back because Hormuz risks ease, yields drop, the rate outlook softens, and gold finally gets room to run on the disinflation trade that two consecutive soft prints should have already delivered.
Daily Spot Gold (XAUUSD) Technical Analysis
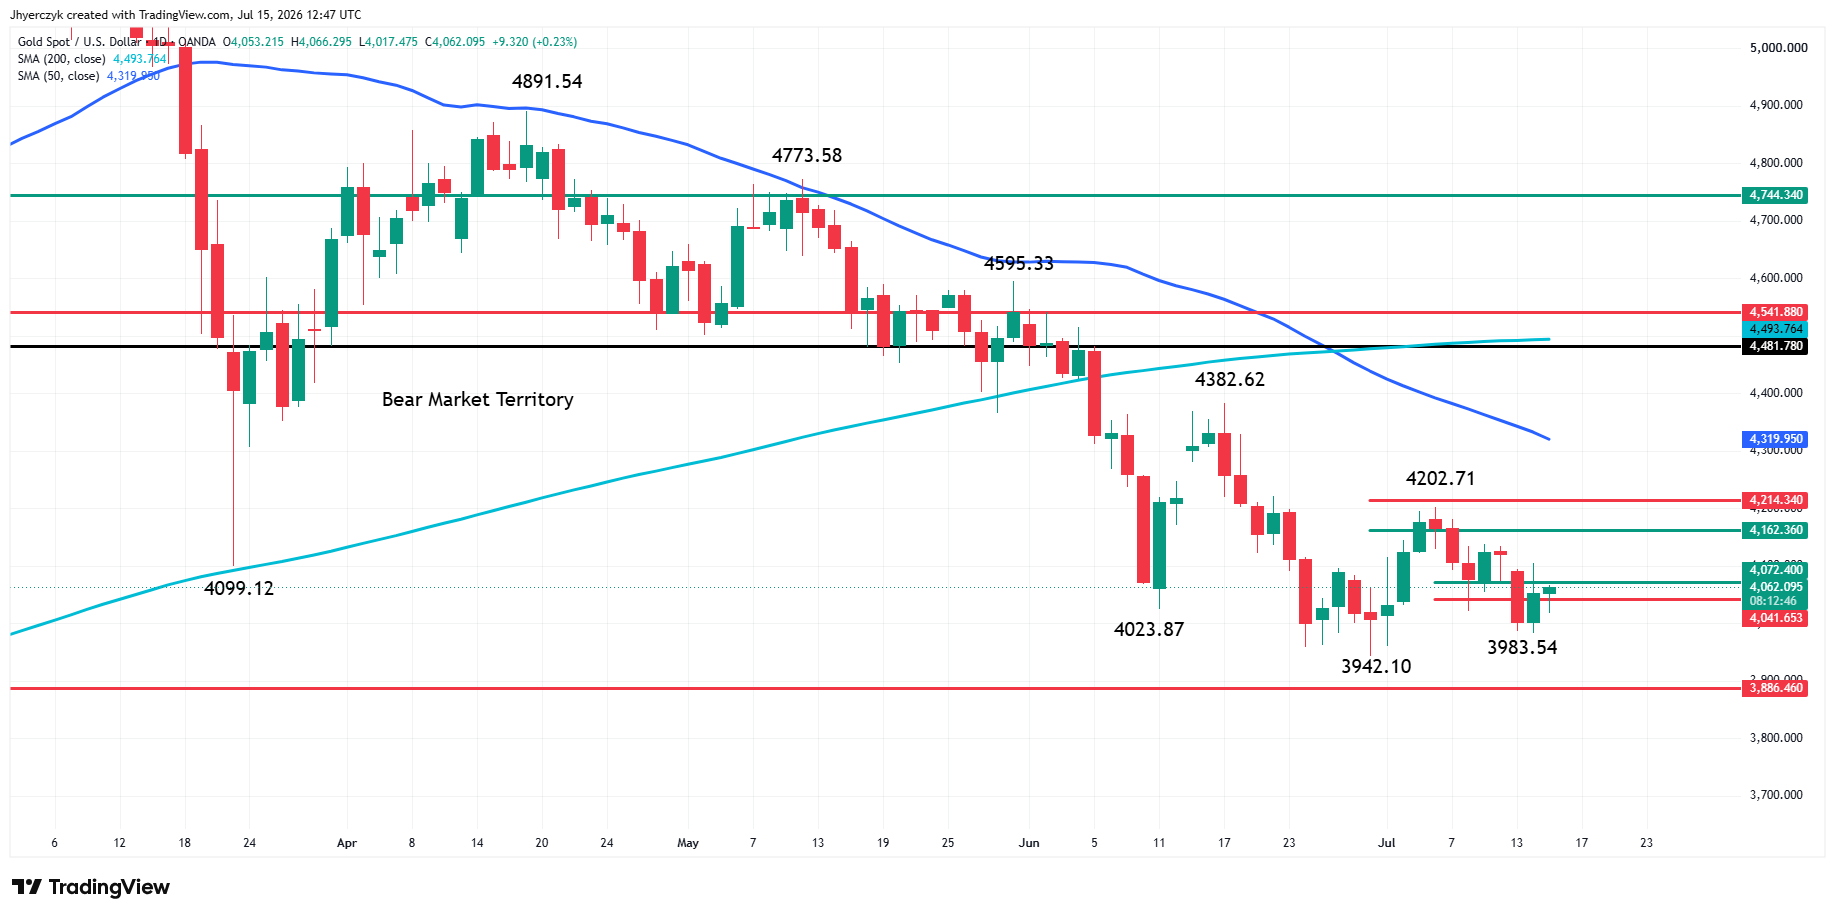
Spot Gold is nearly flat as traders continue to navigate the short-term retracement zone at $4072.40 to $4041.65. This is an important area to watch because either a secondary higher bottom will form or the downtrend will continue. This area is often referred to as a pivot zone. Yesterday’s price action suggests bullish traders are trying to create a secondary higher bottom at $3983.54.
A sustained move over the upper end of the zone at $4072.40 will indicate the presence of buyers, but it will still have to be strong enough to overcome the next retracement zone at $4162.36 to $4214.34, which includes the swing top at $4202.71 in order to reach the 50-day moving average at $4319.95.
If buyers continue to defend against a breakdown under $3942.10 then look for a rangebound trade. One problem I’ve been seeing for months is the lack of interest in aggressively taking out offers. Passively bidding has been the norm, but as you can see on the daily chart, it only leads to more lower lows, which is essentially the definition of a downtrend.
What to Watch
The soft PPI confirmed June inflation was cooling but the market is not trading June anymore. Oil is repricing the inflation outlook forward and Warsh’s testimony left no room for a dovish pivot while crude keeps climbing. Treasury yields refused to follow the soft data lower, and that tells gold traders everything they need to know about where rates are headed if oil stays at these levels. Until crude breaks the other direction and eases the forward inflation pressure, gold stays range-bound with the bias pointing lower.
The pivot zone between $4072.40 and $4041.65 is where this resolves. Buyers are trying to build a secondary higher bottom but passive bidding has only produced lower lows for months. A sustained push above $4072.40 opens the path toward the 50-day, but getting there requires a catalyst the inflation data alone has not been able to provide.
If you’d like to know more about how to trade gold, please visit our educational area.