Natural Gas Technical Analysis
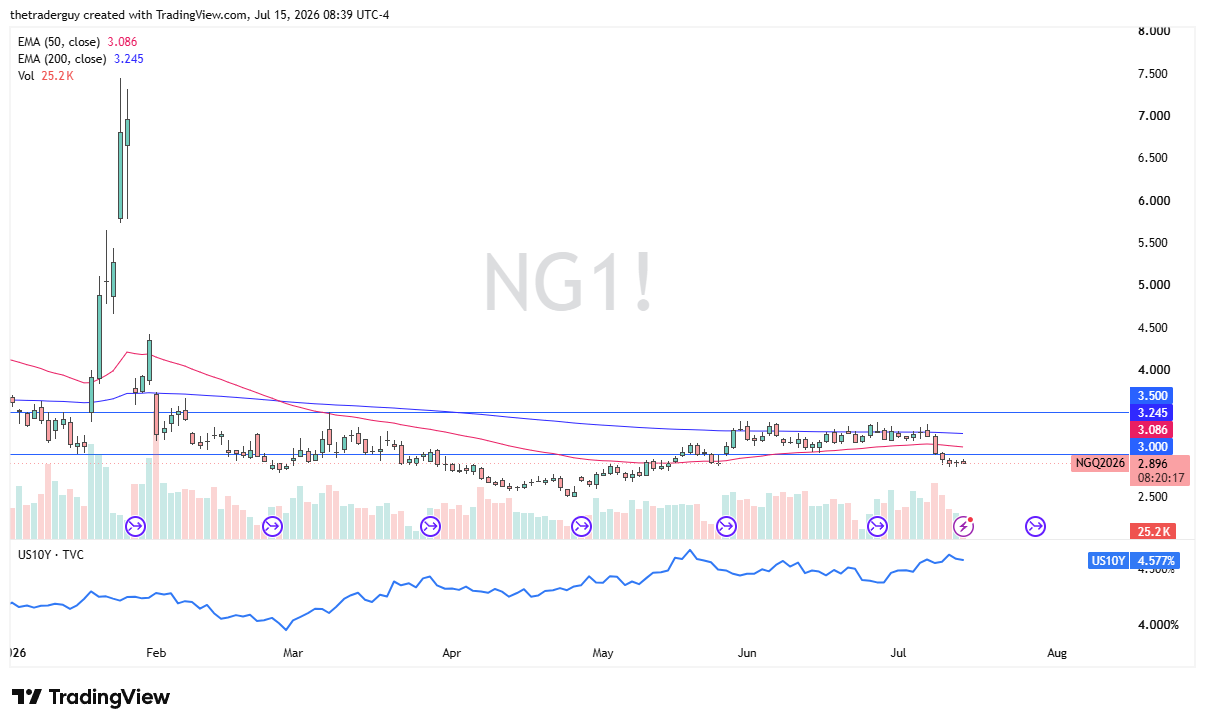
Natural gas markets continue to look very quiet early on Wednesday as we are sitting just below the $3.00 level. This is a large, round, psychologically significant figure, and one that has clear historical importance.
Currently, we are trading below both the 50-day EMA and the 200-day EMA, which shows that the longer-term trend is still very much to the downside. The 50-day EMA sits right around the 3.09 level, while the 200-day EMA is higher up near 3.25. As long as we stay below these moving averages, any rally at this point should be looked at with a certain amount of skepticism.

Technical Support and Weather Catalysts
The market behavior over the last few weeks has been decidedly bearish, but we are starting to see a bit of stabilization near the $2.50 level below. That is an area that has offered significant support in the past, and it looks like buyers are trying to step in and defend it. The question now, of course, is whether or not we can get some type of catalyst to turn things around, perhaps coming from the weather headlines or the upcoming storage report on Thursday.
If we do get a sudden burst of momentum and manage to break above the 50-day EMA, then the next major target would be that 200-day EMA near 3.25. On the alternative scenario, if we break down below the $2.50 level, that could open up a much deeper drop to the $2.00 level. For now, it looks like a very flat and sideways market as traders wait for more clarity.
If you’d like to know more about how to trade natural gas, please visit our educational area.