Gold Consolidates Below Resistance as Support Holds
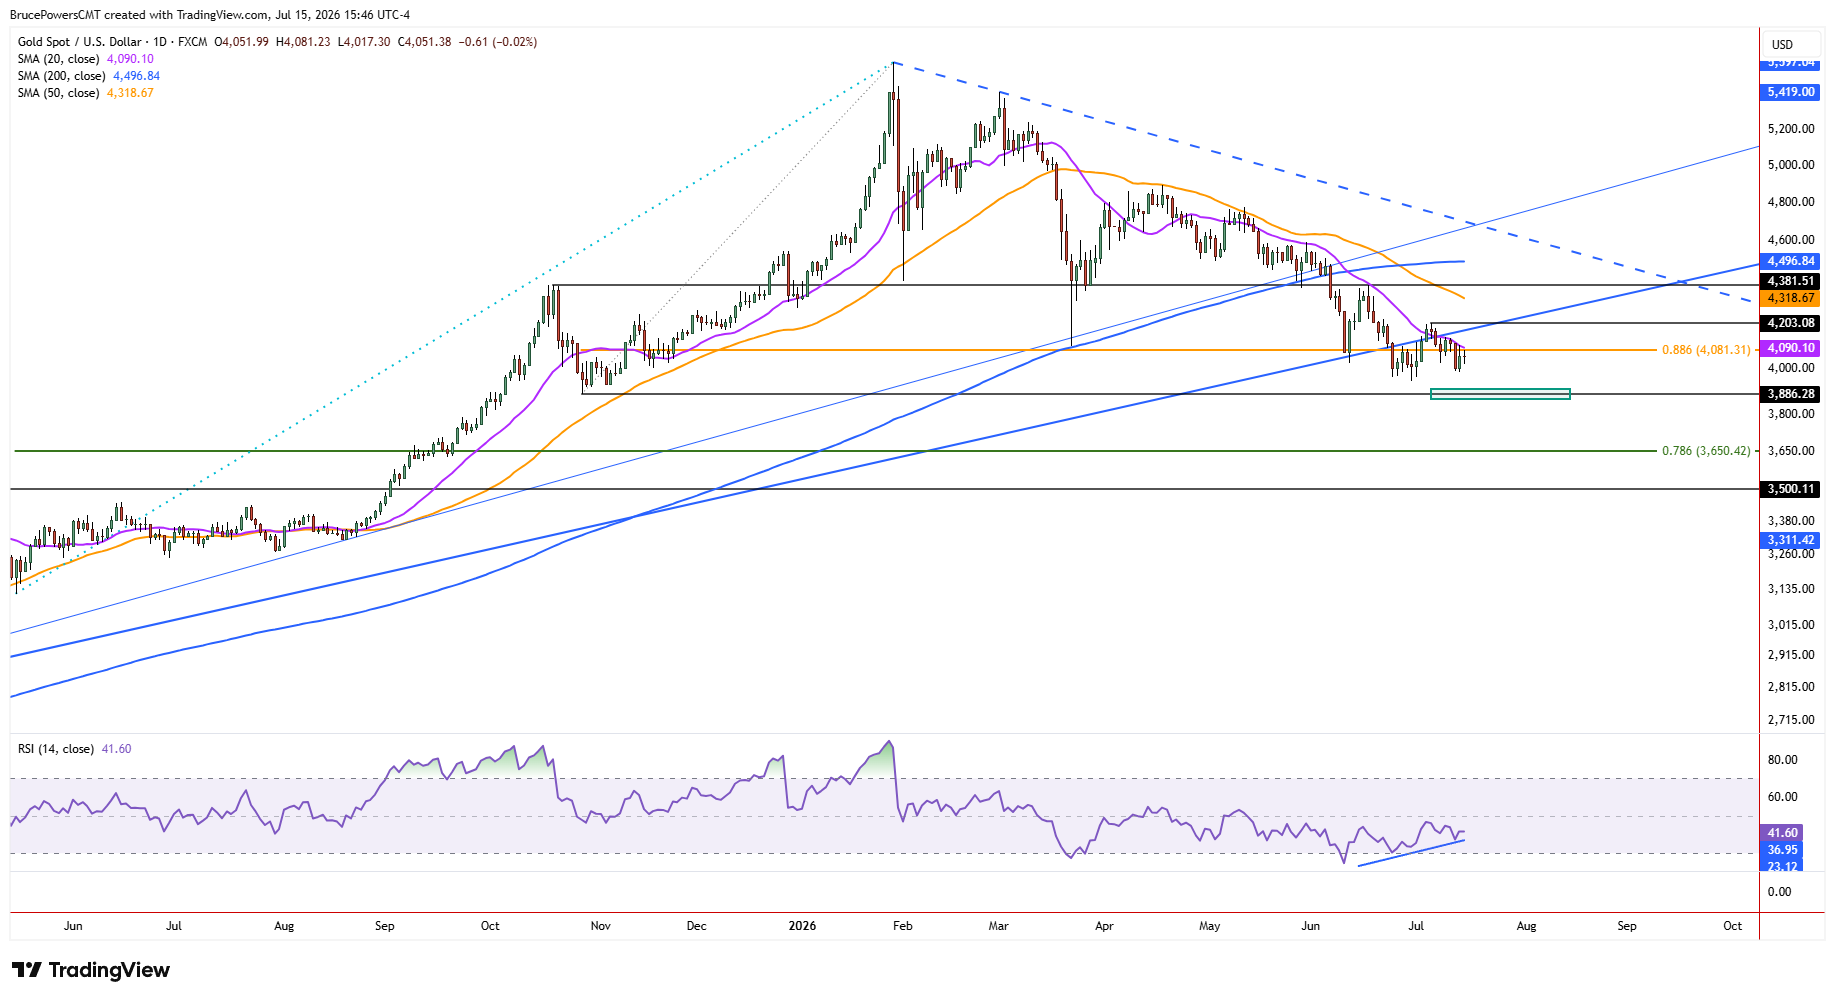
Gold traded sideways for the third consecutive day on Wednesday, as it further confirmed resistance near the 20-day moving average with the day’s lower high of $4,081. Tuesday’s low of $3,983 is near-term support, and a decline below that level may lead to a break below the prior corrective low of $3,942 from two weeks ago. That would confirm a new swing low before the $3,886 price zone is tested as support.
A swing low from October defines that lower potential target. Therefore, the ability of gold to hold near-term support will likely determine whether the current consolidation develops into another leg lower or becomes the foundation for a recovery attempt.

Bearish Pressure Lacks Follow-Through
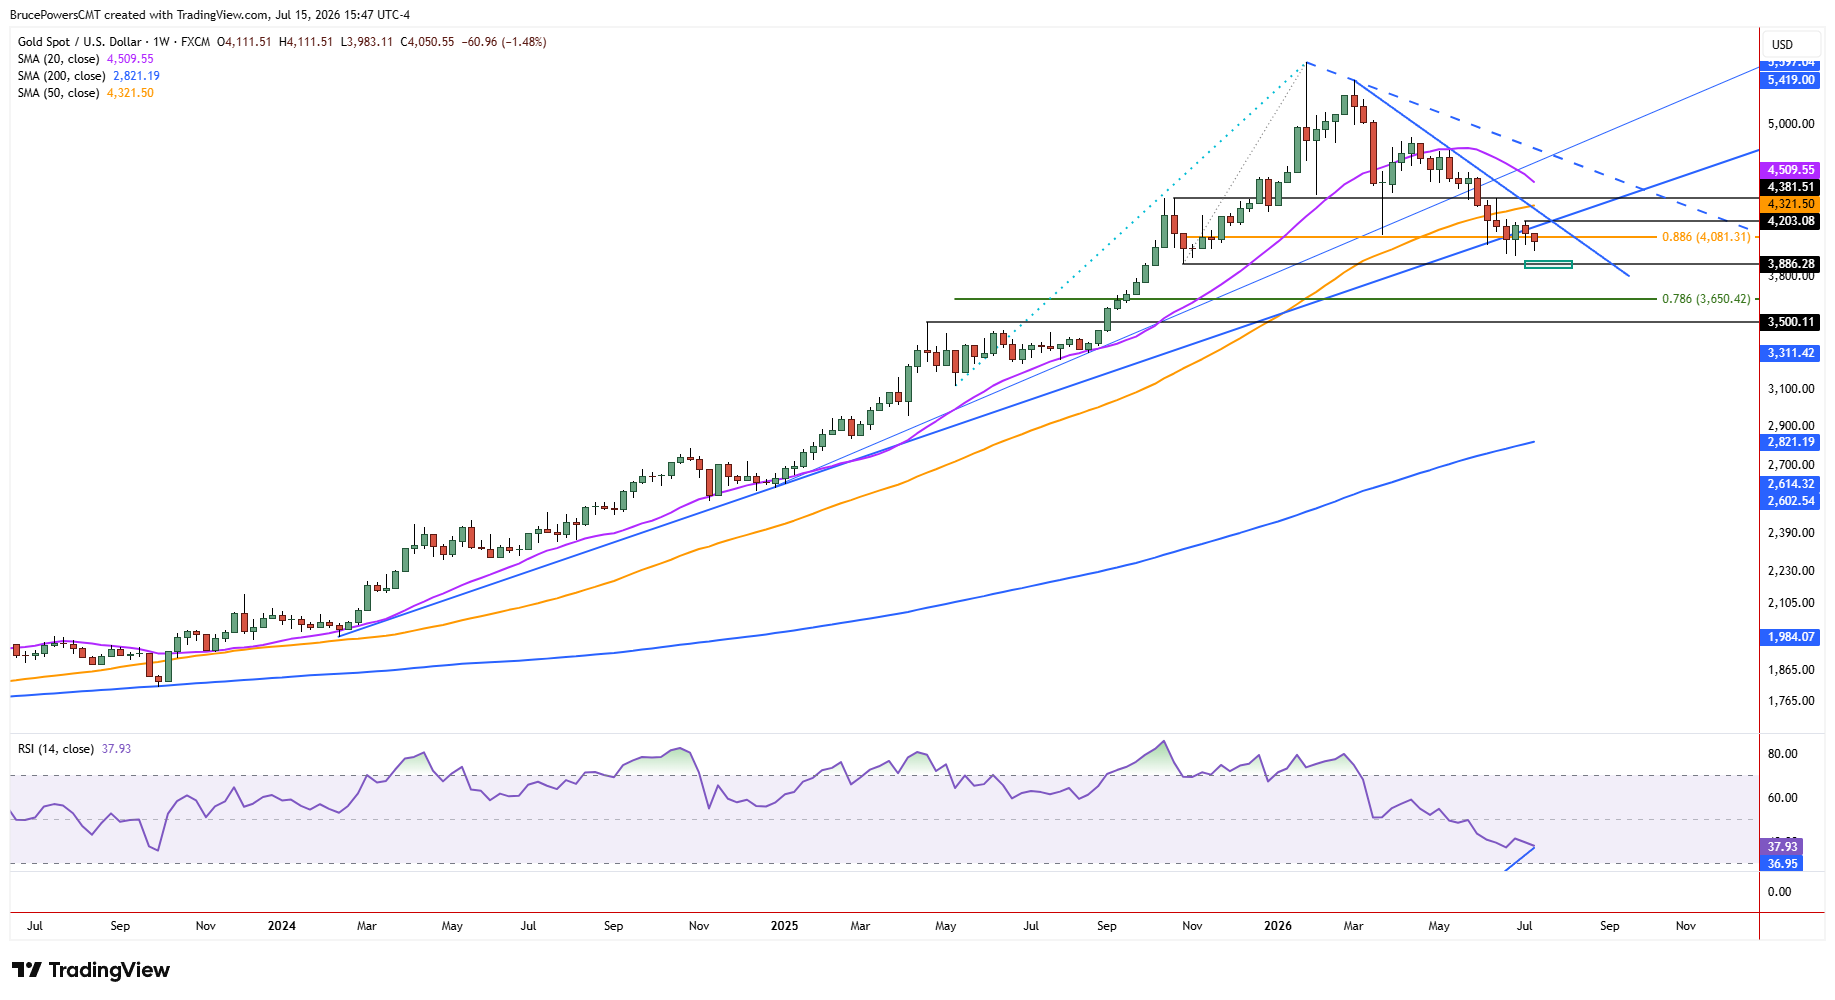
Despite the possibility of further downside, especially due to the break below a long-term uptrend line three weeks ago and the consistent confirmation of dynamic resistance near the 20-day average, there have been little signs of bearish momentum. Gold has essentially traded sideways since the breakdown, which may be more obvious on the weekly chart. Also, a bearish divergence is present in the Relative Strength Index (RSI), indicating a slowdown in bearish momentum. This lack of follow-through from sellers suggests that the breakdown has not yet produced downside acceleration typically seen after a significant trend breakdown.
Resistance Levels Define the Recovery Path
A decisive reclaim of the 20-day moving average, now near $4,091, would be a sign of strength that may only be the beginning. Tuesday’s high of $4,104 would provide a more reliable pivot, followed by the recent slightly lower swing high of $4,138. Nonetheless, the more significant lower swing high at $4,203 is a key part of the declining trend structure, and a rally above it would provide a bullish reversal signal of trend structure. By then, gold would have rallied above both the 20-day moving average and the uptrend line, which would then convert to dynamic support indicators.
Double Bottom Formation Could Signal Trend Shift
If a breakout above $4,203 occurs prior to new trend lows, that breakout may also trigger a double bottom reversal pattern. Tuesday’s low would be the second bottom of the formation in that case. The first upside target would then be the falling 50-day moving average at $4,319. However, given its location when tested as resistance, it may be closer to the double bottom neckline at $4,203 than it currently is.
This would suggest that bullish momentum from a bottom breakout should be strong enough to break above the moving average. That would put gold on target for a test of resistance near the 200-day moving average, now at $4,497. A successful move above $4,203 would therefore represent a meaningful shift, transforming the current sideways consolidation from a vulnerable pause into a potential reversal structure.
Gold Price Forecast
Every new Gold analysis as it publishes, today's technical signal and key levels, live price — on one page.
See all Gold forecastsIf you’d like to know more about how to trade gold and silver, please visit our educational area.