Natural Gas Attempts to Stabilize After Testing Support
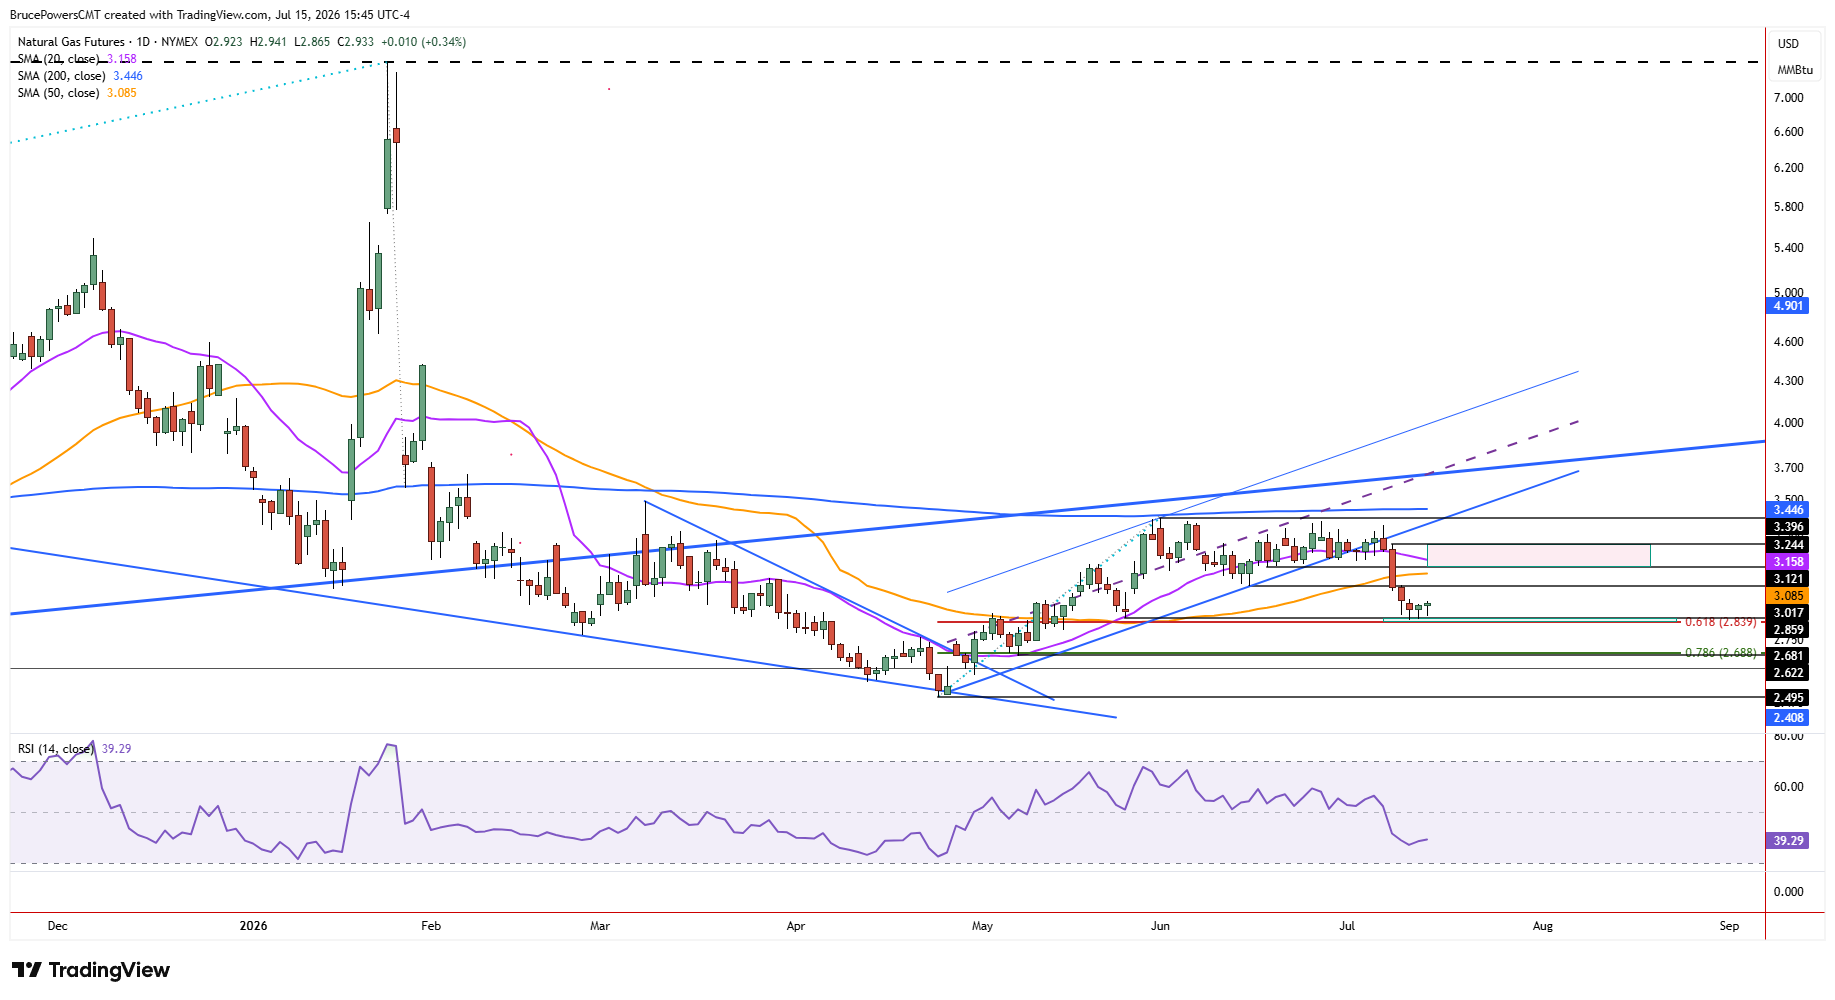
A one-day bullish reversal triggered in natural gas on Wednesday, as it broke out above Tuesday’s range to reach a high of $2.94. The breakout will be confirmed with a daily close above $2.93, Tuesday’s high. Support has been tested over the past few days near the retracement low of $2.85, established on Monday at the confluence of a swing low of $2.86 and the 61.8% Fibonacci retracement of the previous advance at $2.84.
Given the validation of support and Wednesday’s sign of strengthening momentum, a counter-trend rally to test resistance zones looks likely before the next risk of further downside. Nonetheless, key support remains near the $2.85 low. This initial bullish reversal is important because a successful bounce from support would determine whether natural gas can recover toward overhead resistance before the broader downtrend resumes.

Confirmation Needed Above Short-Term Resistance
Further confirmation of strength is now needed with an advance above the three-day high of $2.95. That would provide another daily reversal signal and further confirm a move off the bottom. Following a test of prior support levels as resistance, natural gas is anticipated to turn back down. This is classic bearish trend continuation behavior. However, the strength and duration of the counter-trend rally will likely depend on how price responds as it approaches these former support zones.
Resistance Cluster Defines the Next Test
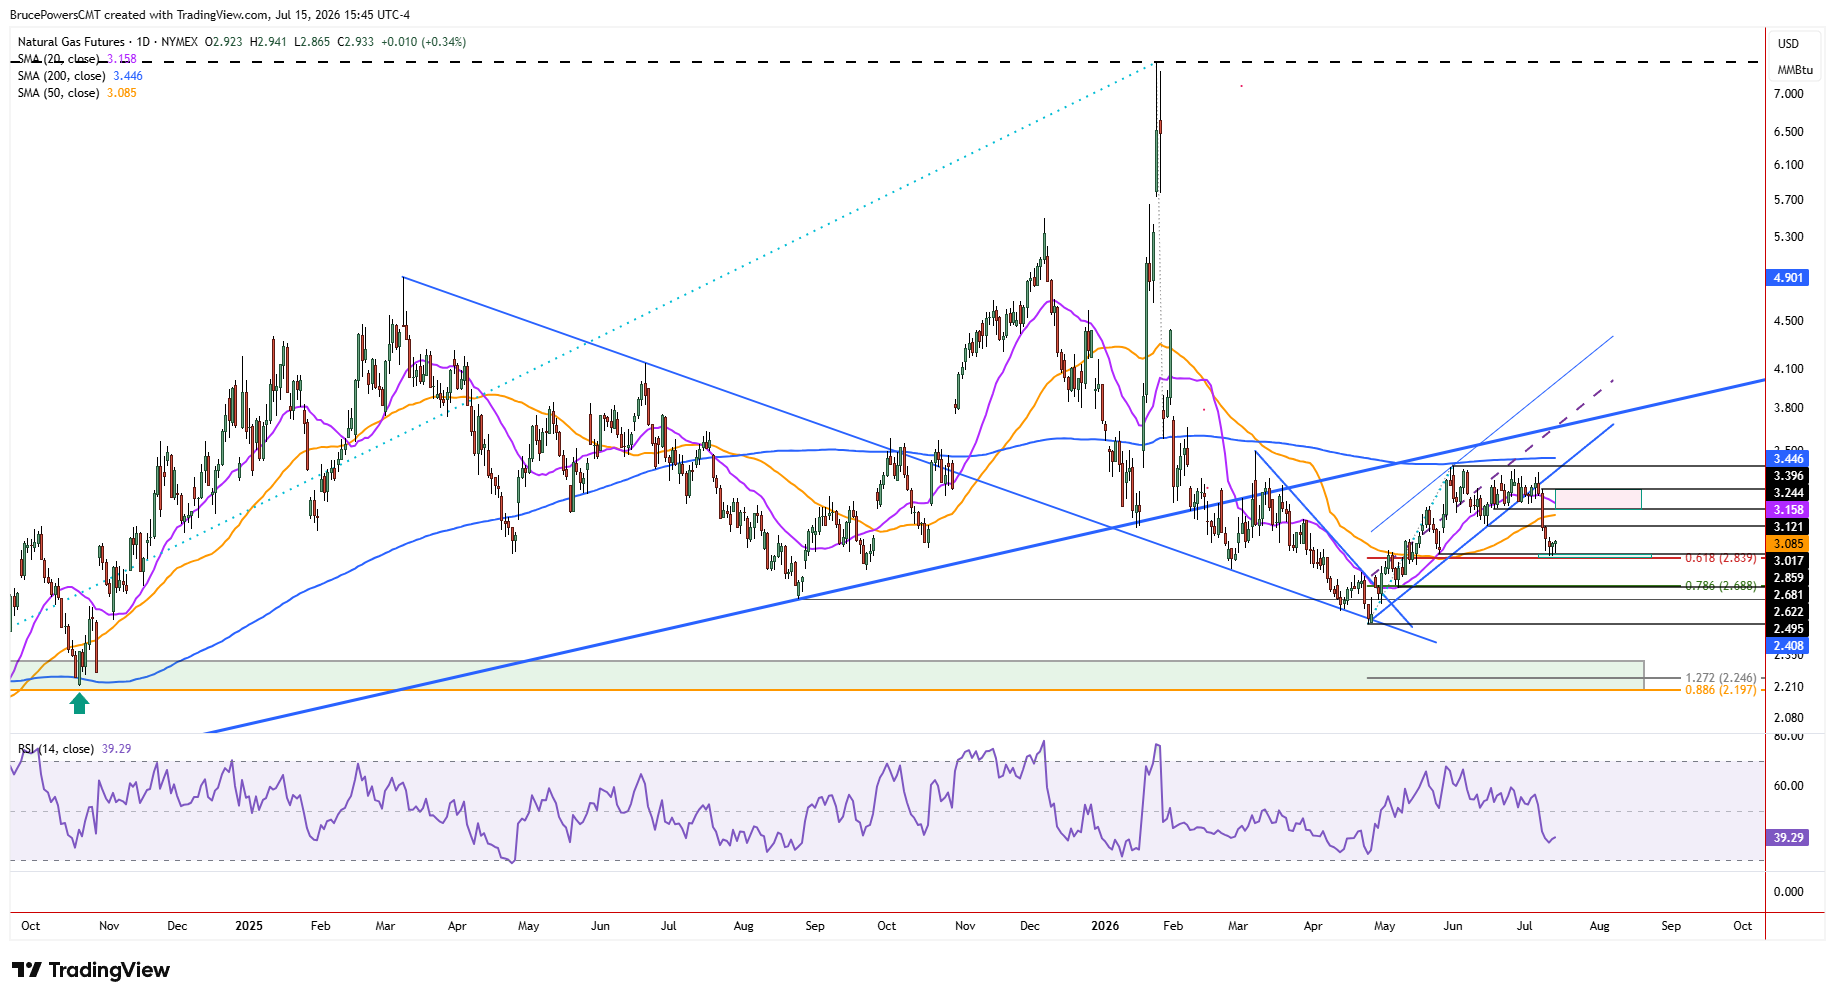
Key levels to watch for resistance during an advance include the prior swing low at $3.02, the 50-day moving average near $3.09, and an interim swing low near $3.12. However, the area from $3.12 marks the beginning of a range of potential resistance up to around last Thursday’s high of $3.24. There is also the falling 20-day moving average at $3.16, which is continuing to decline.
A minimum counter-trend rally is anticipated to test resistance at the 50-day moving average. Since that trend indicator was confirmed as support shortly after its last reclaim in early May, the failure of support from the indicator on the way down amplifies the significance of the decline. Natural gas broke decisively below the 50-day average last Thursday with little hesitation and confirmed the breakdown with a daily close below the average.
Moving Averages Could Cap the Recovery
Both the falling 20-day moving average and rising 50-day moving average seem to be heading toward the $3.12 price range. Nonetheless, their confluence would establish a more significant resistance zone and increase the chance for an eventual bearish continuation. Therefore, while Wednesday’s reversal suggests a potential short-term recovery, the reaction near this resistance cluster will likely determine whether the broader bearish trend remains intact.
Natural Gas Price Forecast
Every new Natural Gas analysis as it publishes, today's technical signal and key levels, live price — on one page.
See all Natural Gas forecastsIf you’d like to know more about how to trade natural gas, please visit our educational area.