
Advertisement
Advertisement
USDCAD, EURCAD, GBPCAD and CADCHF: Technical Forecast
By:
USDCAD Even if the USDCAD managed to bounce from 1.3040-30 horizontal mark, the 50-day SMA, presently at 1.3170, quickly followed by the 1.3230 descending
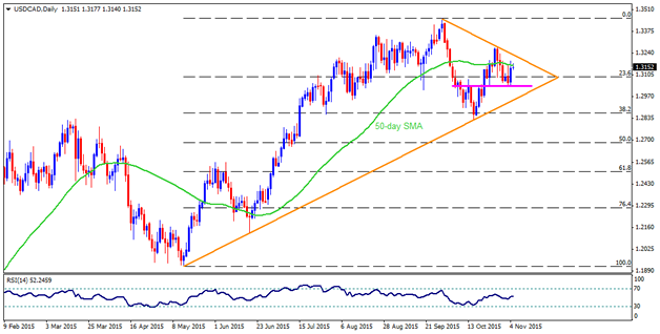
USDCAD
Even if the USDCAD managed to bounce from 1.3040-30 horizontal mark, the 50-day SMA, presently at 1.3170, quickly followed by the 1.3230 descending trend-line resistance, connecting highs marked in September and October, may restrict the pair’s near-term up-move. Given the ability to surpass 1.3230 on a closing basis, 1.3300 and 1.3350 are likely consecutive resistances that the pair could witness during its northward trajectory to September highs of 1.3450. Meanwhile, 23.6% Fibonacci Retracement of its May – September surge, around 1.3090, can act as immediate support for the pair, breaking which the 1.3040-30 horizontal support area can limit the pair’s further downside. Should it fail to hold 1.3030, nearly six month old ascending trend-line support, at 1.2950-45 currently, becomes pivotal to stop the pair’s south-move while consecutive decline below which can find 38.2% Fibo, near 1.2870, and the 1.2770-50 support-zone as following downside levels.
EURCAD
EURCAD’s dip from the descending trend-line resistance, joining highs marked in August, September and October, triggered the pair’s considerable declines that broke six month old ascending trend-line support on Tuesday, indicating further downside towards 200-day SMA, near 1.4120 at present. If the pair continue its south-run below 200-day SMA, the 1.4000 psychological magnet, encompassing 61.8% Fibonacci Retracement of its April – August up-move, becomes a strong support to limit the pair’s further plunge. On the upside break of 1.4400 immediate resistance, mentioned by the ascending trend-line, negates the pair’s recent breakdown and can pull it back to 1.4450-60 area before witnessing 38.2% Fibo, near 1.4590, followed by the 1.4660 resistances. Though, pair’s further up-move beyond 1.4660 can be restricted by 1.4750 important resistance mark, comprising 50-day SMA and the said descending trend-line resistance. Moreover, a sustained break above 1.4750 can open the room for the pair’s upward trajectory towards 1.5000 area.
GBPCAD
Ever since the GBPCAD surpassed 2.0100 horizontal mark, also including the 100-day SMA, it kept on trading between the 2.0300 and the 2.0100 area wherein the 2.0300, encompassing 23.6% Fibo of its April – August rally and two month old descending trend-line, limits the pair’s up-move. If the pair surpasses the 2.0300 level on a closing basis, it can quickly rise to 2.0400 and the 2.0550-60 consecutive resistance while sustained trading above 2.0560 can enable the pair to aim for August highs of 2.0950; though, 2.0600 and the 2.0680 may act as intermediate resistances. Alternatively, a daily break below 2.0100 can be followed by the 2.0000 psychological magnet and the 38.2% Fibo, near 1.9880, before the pair can test 1.9760-50 important horizontal support area. If the pair dips below 1.9750, chances of its 1.9550 re-test, comprising 50% Fibo, can’t be denied.
CADCHF
Following its reversal from two month old ascending trend-channel, the CADCHF managed to register a breakout above 200-day SMA; however, the said channel’s resistance line, presently at 0.7610, limited the pair’s further up-move while 200-day SMA level, around 0.7520 now, acts as an immediate support. Given the pair’s inability to hold 200-day SMA, it could plunge to 50% Fibo of its April – August downside, near 0.7450. Moreover, a sustained downtrend below 0.7450 may find 0.7380 as an intermediate support before it could test the 38.2% Fibo, also including the channel support, near 0.7340, that can limit the pair’s further downside. However, the pair’s capacity to close above 0.7610 can strengthen the pair to aim for 0.7700 mark and the 76.4% Fibo, near 0.7740, breaking which chance of its rally to 0.7830 becomes brighter.
Follow me on twitter to discuss latest markets events @Fx_Anil
About the Author
Anil Panchalauthor
An MBA (Finance) degree holder with more than five years of experience in tracking the global Forex market. His expertise lies in fundamental analysis but he does not give up on technical aspects in order to identify profitable trade opportunities.


Advertisement