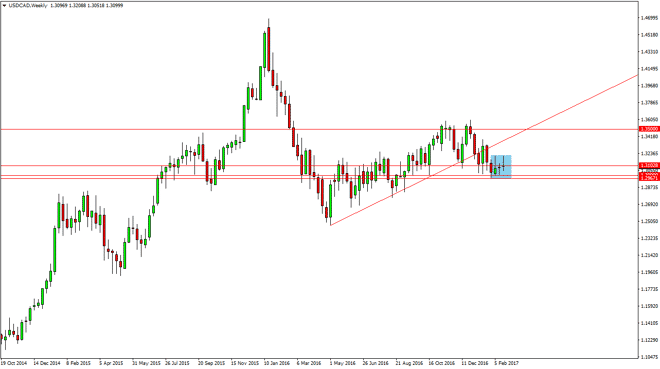
The USD/CAD pair went back and forth during the week, forming a shooting star of sorts. What’s interesting is that the Friday candle is a hammer, so
The USD/CAD pair went back and forth during the week, forming a shooting star of sorts. What’s interesting is that the Friday candle is a hammer, so expect more choppiness and back and forth type of trading in this market. That almost makes it impossible to trade this market from a longer-term perspective. Having said that, if we can break above the top of the shooting star for the week, I think that’s a very bullish sign and then we should reach towards the 1.35 level above. Until oil figures out what once to do, this pair is going to be difficult.
Chris is a proprietary trader with more than 20 years of experience across various markets, including currencies, indices and commodities. As a senior analyst at FXEmpire since the website’s early days, he offers readers advanced market perspectives to navigate today’s financial landscape with confidence.