USDCAD recently broke above the resistance trend line of the price channel on the daily chart, suggesting that lengthier consolidation for the downtrend
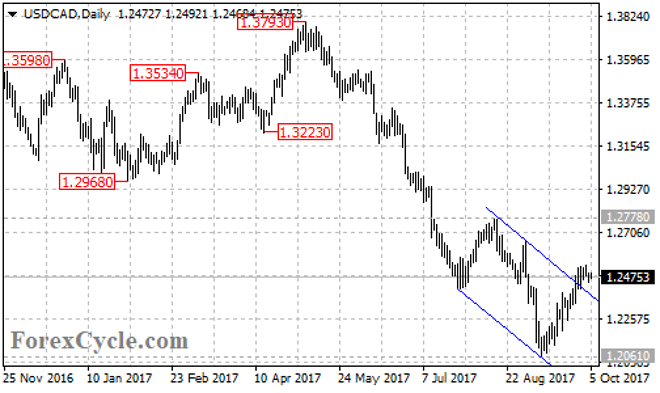
USDCAD recently broke above the resistance trend line of the price channel on the daily chart, suggesting that lengthier consolidation for the downtrend from 1.3793 is needed. Range trading between 1.2061 and 1.2778 would likely be seen over the next several weeks.
On the 4-hour chart, the USDCAD pair extended its upside movement in a rising bullish price channel with support at its bottom trend line now at around 1.2435. As long as the price is in the channel, the upside movement from 1.2061 could be expected to continue and a breakout of 1.2538 resistance could trigger further upside move towards the top trend line of the channel.
On the other side, a break through below the bottom of the channel could take price back to test next support level at 1.2416. Below this level would suggest that the short term uptrend from 1.2061 had completed at 1.2538 already, then the pair would find next support at the 61.8% Fibonacci retracement taken from 1.2061 to 1.2538 at 1.2243, followed by 76.4% retracement at 1.2174.
For long term analysis, USDCAD broke below a major support trend line from the September 2012 low of 0.9632 to the July 2014 low of 1.0619 on the weekly chart. As long as the price is below 1.2778 key resistance, the price action in the trading range between 1.2061 and 1.2778 could be treated as consolidation of the downtrend from 1.3793. Further decline could be expected after the consolidation and next target would be at 1.1400 – 1.1600 area. This would be the final target of the downtrend.
Support levels: 1.2435 (the bottom of the price channel on the 4-hour chart), 1.2416 (near term support), 1.2243 (the 61.8% Fibonacci retracement), 1.2174 (the 76.4% Fibonacci retracement), 1.2061 (the September 8 low), 1.1400 – 1.1600 area.
Resistance levels: 1.2538 (near term resistance), 1.2778 (the August 15 high), 1.2968 (the January 31 low).