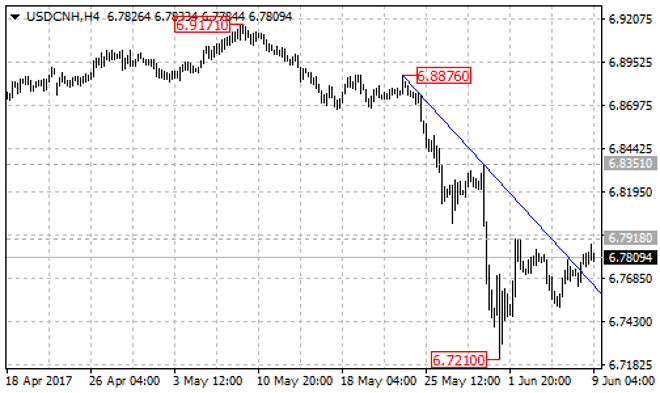
USDCNH recently broke above the bearish trend line from the May 24 high of 6.8876 to the May 31 high of 6.8351 at 6.7725 on its 4-hour chart and is now
USDCNH recently broke above the bearish trend line from the May 24 high of 6.8876 to the May 31 high of 6.8351 at 6.7725 on its 4-hour chart and is now facing the 6.7918 resistance. A break of this level will confirm that the bearish movement from the May 9 high of 6.9171 had completed at 6.7210 already, and this could trigger another bullish movement towards 7.0000.
A break of 6.7918 resistance could bring price the next resistance level of the March 15 low of 6.8450, above this level will confirm that the whole correction pullback started from the January 3 high of 6.9867 is complete, then next target would be at around 6.9170 which acted as the horizontal top trend line of the triangle pattern on its daily chart.
However, as long as the USDCNH pair is below 6.7918 resistance, the price action from the June 1 low of 6.7210 could possibly be consolidation of the bearish movement from 6.9171, and another fall towards 6.6500 is still possible after the consolidation. Near term support is at the 61.8% Fibonacci retracement taken from 6.7210 to 6.7918 at 6.7480, and the key support is at 6.7210, a breakdown below 6.7210 support could signal resumption of the downtrend.
Support levels: 6.7480 (61.8% Fibonacci retracement), 6.7210 (the key support), 6.6500.
Resistance levels: 6.7918 (near term resistance), 6.8450 (March 15 low), 6.9170 (the top of the triangle pattern).