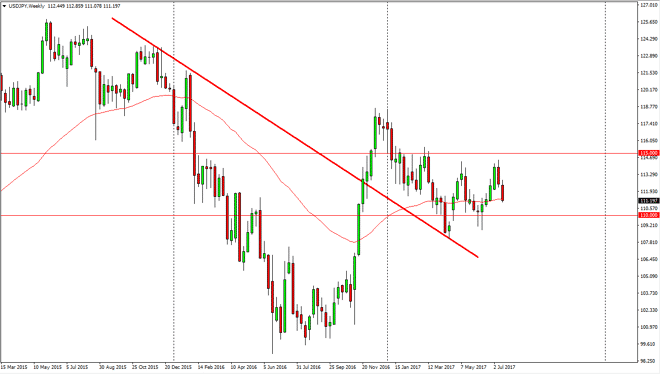
The USD/JPY pair fell during the week, slicing through the 112 level rather handily. The market looks likely to find support at the 110 handle though, and
The USD/JPY pair fell during the week, slicing through the 112 level rather handily. The market looks likely to find support at the 110 handle though, and I think that buyers will continue to be attracted to this level, and I’m willing to buy close to the 110 handle. I believe that a supportive candle will present itself that we can start buying. The market could very well bounce from there and reach towards the 114.50 level above. A break above the 115 handle would signify that were going to go much higher, but there is a lot of work to be done between now and then. Once we do break above the 115 handle, the market should then go looking for the 118.50 level. I still believe in the uptrend, and I believe that the Federal Reserve will continue to raise interest rates going forward, regardless of what some pundits may think.
I’m waiting for support in this market, so therefore I will be very patient and waiting on a signal to start going long. Shorting is possible for shorter-term traders, but for myself I believe that there are much more in the way of rewards by being patient and waiting for the longer-term move closer to the 110 level. If we were to break down below the 109 level, then I think all bets are off and we will break down significantly. However, I think that’s very unlikely in this market going forward.
Chris is a proprietary trader with more than 20 years of experience across various markets, including currencies, indices and commodities. As a senior analyst at FXEmpire since the website’s early days, he offers readers advanced market perspectives to navigate today’s financial landscape with confidence.