
Bitcoin (BTC) had nearly everything going its way this week. Yet the cryptocurrency is still on track to finish roughly 3% lower.

That divergence is particularly striking given Bitcoin’s reputation as a high-beta proxy for US technology stocks.
Wall Street has pushed to fresh record highs as inflation cools and traders dial back expectations for a Federal Reserve rate hike in September, conditions that would normally favor speculative assets.
So why is Bitcoin refusing to follow stocks higher? Let’s examine what is holding BTC back and what it could mean for its price heading into next week.

Bitcoin Is Facing Its Own Demand Problem
BTC fell from around $65,000 on Monday to as low as $62,470 (data from Bitstamp) by Friday. In contrast, the tech-heavy Nasdaq 100 closed the week approximately 1% higher.
Sandeep Pyapali, founder and CEO of payments firm Mesta, told Barron’s this week’s PPI and jobless-claims data was a “clean dovish signal” combining cooler inflation with a weakening labor market.
But he noted that crypto, unlike US stocks, failed to respond as expected, citing weak underlying demand and continued ETF outflows as structural headwinds.
Bitcoin Price Forecast
Every new Bitcoin analysis as it publishes, today's technical signal and key levels, live price — on one page.
See all Bitcoin forecasts
Lack of ‘CLARITY’ is Hurting Bitcoin
Washington may have been a key catalyst behind the weaker crypto demand.
The Senate entered its five-week recess without advancing the CLARITY Act, while the Securities and Exchange Commission canceled a scheduled meeting on new fundraising rules for crypto companies.
Prediction-market odds of CLARITY passing this year had subsequently fallen under 20% as of Sunday, Aug. 16.

NYDIG’s Greg Cipolaro had already warned in late July that the bill lacked a credible path to the 60 Senate votes needed for passage, with disagreements over ethics, banking rules and other provisions remaining unresolved.
Last month, Anthony Pompliano, Founder & CEO of Professional Capital Management, argued that Bitcoin itself already has substantial regulatory clarity because its status as a digital commodity is broadly established.
In his view, CLARITY matters much more for the wider crypto industry than it does for BTC specifically.
That leaves another potentially bigger explanation: artificial intelligence.
AI is Stealing Bitcoin’s “High-Beta” Thunder
Michael Saylor, executive chairman at Strategy (MSTR), the largest Bitcoin-holding public company on record, offered perhaps the clearest explanation earlier this month.
Saylor said the enormous amount of capital being committed to artificial-intelligence infrastructure by companies such as Alphabet (GOOGL), Meta (META), SpaceX (SPCX) and others represents the largest of several near-term headwinds for Bitcoin.
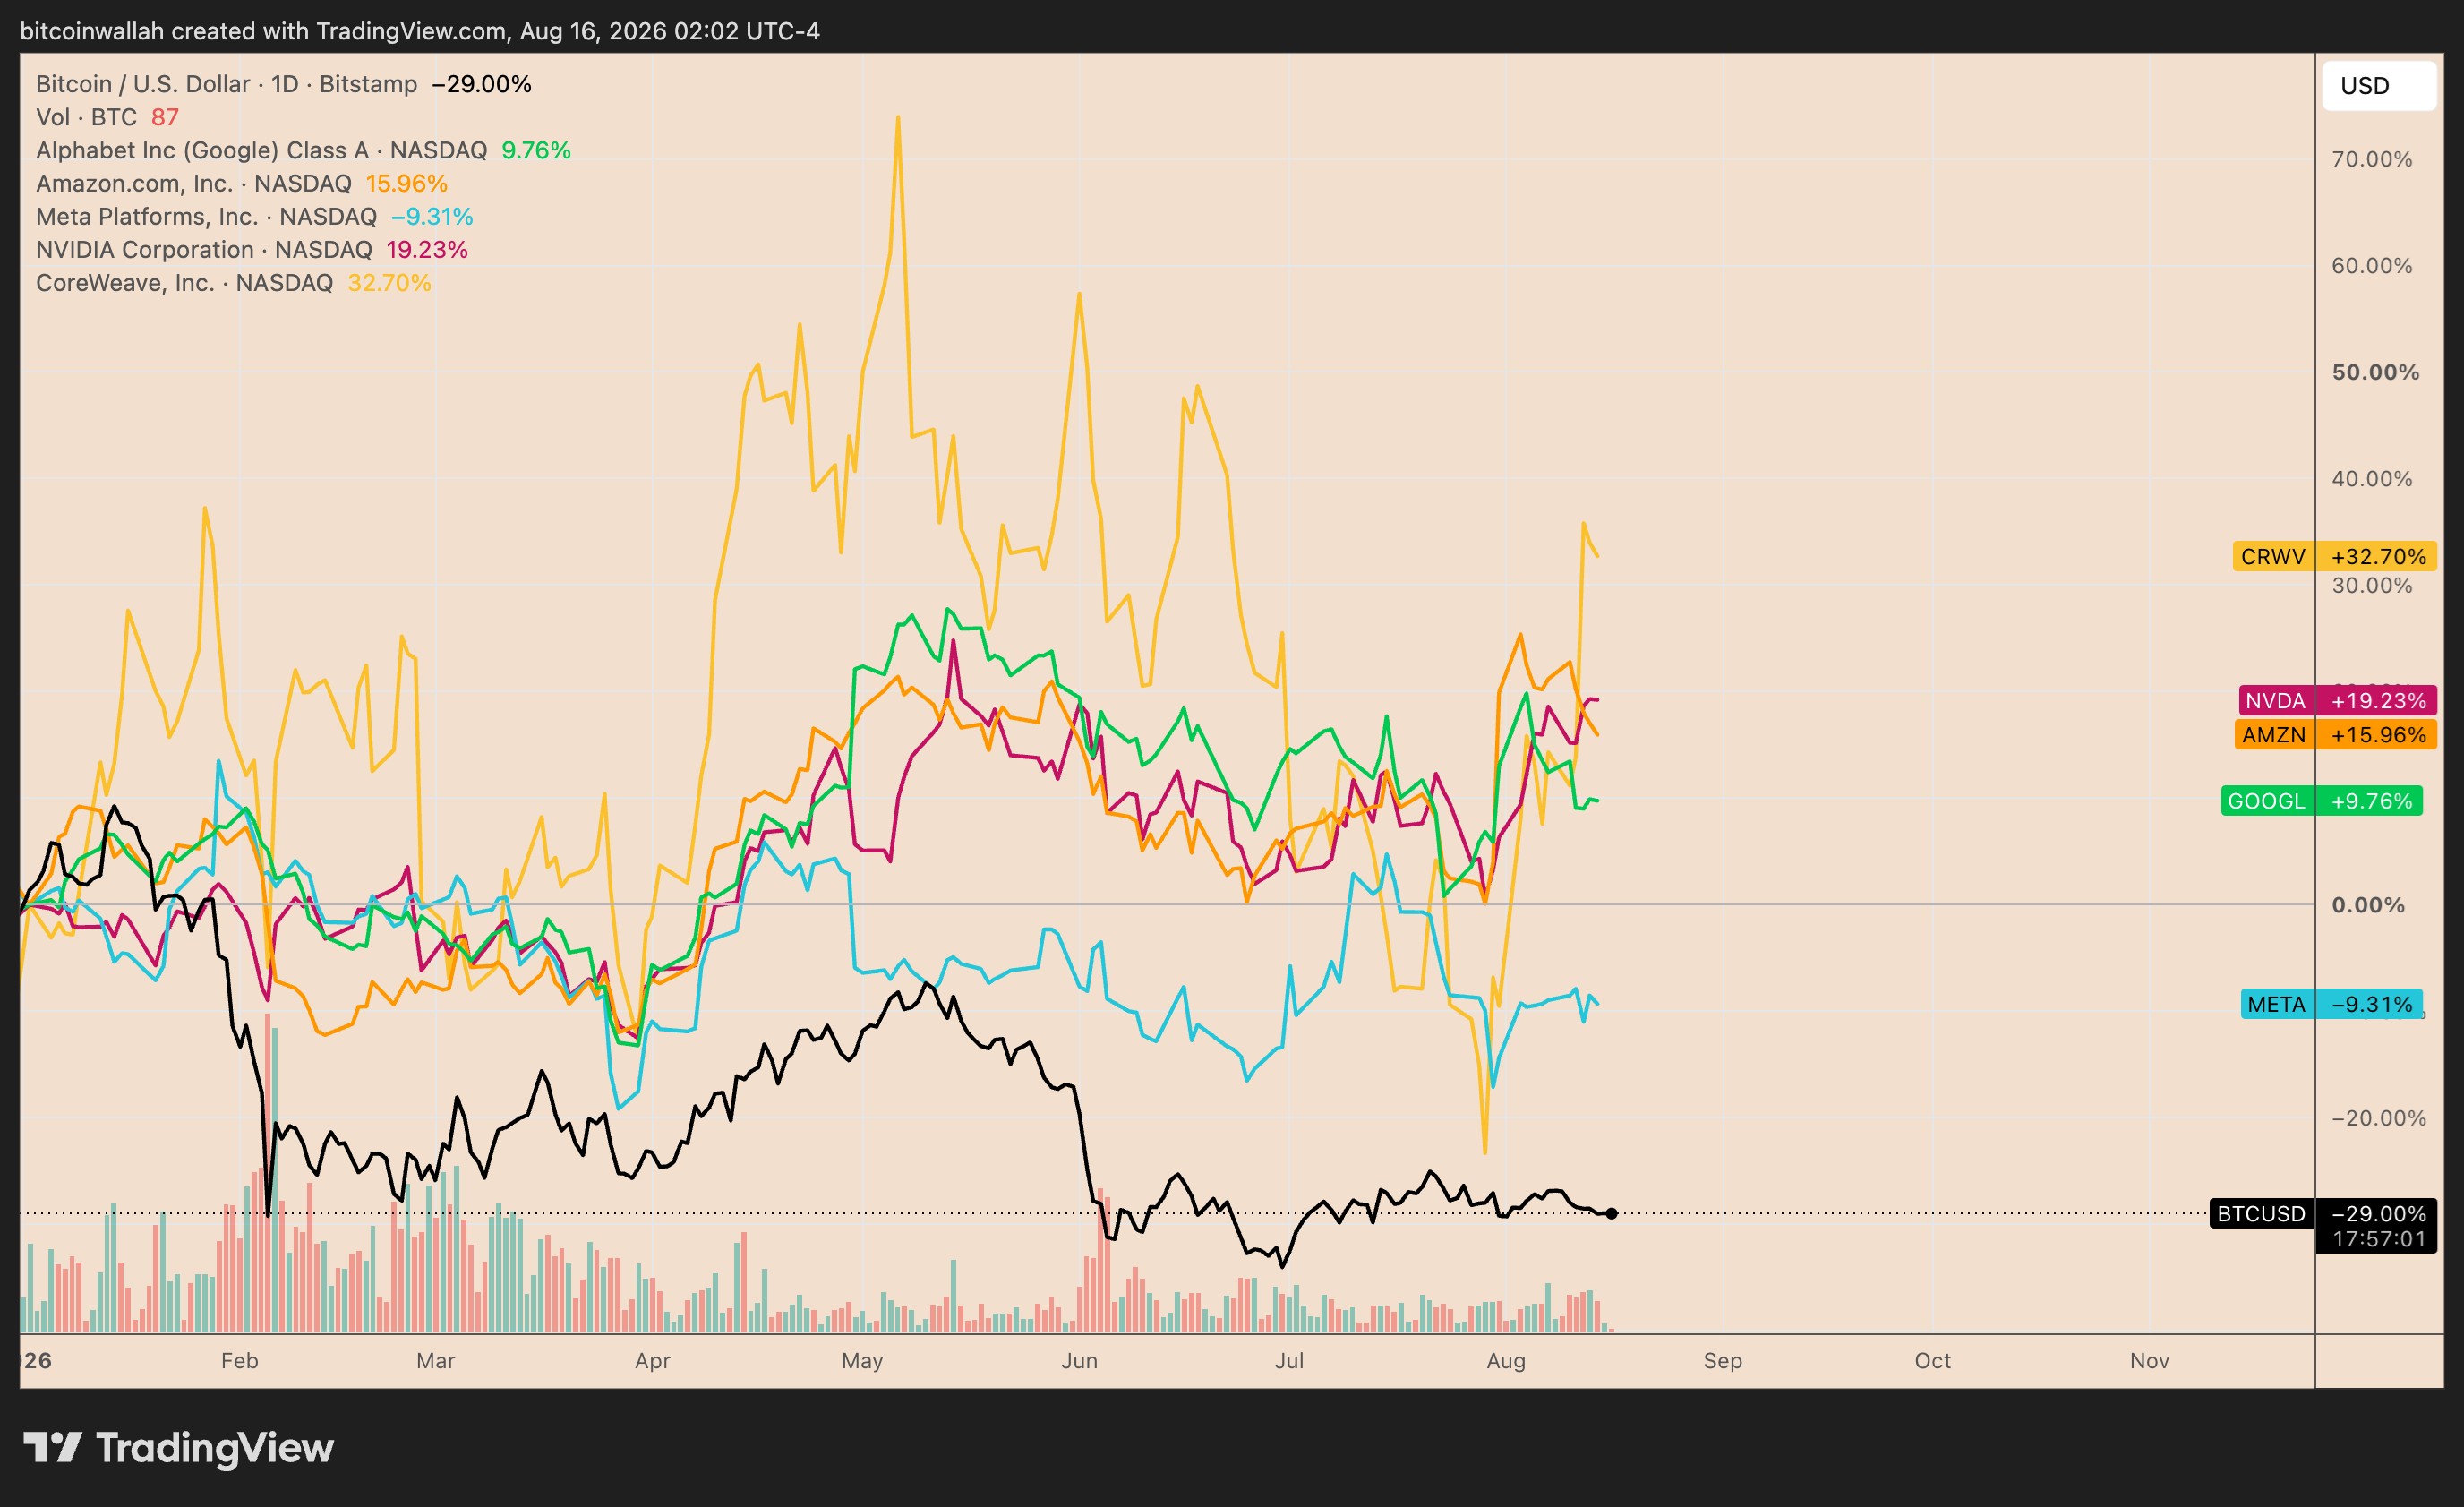
In other words, Bitcoin and AI are competing for some of the same speculative and institutional capital. And right now, AI is winning.
Take ETFs for example. As of Aug. 14, US spot Bitcoin ETFs had recorded $5.48 billion in net outflows in 2026, despite recovering $459.6 million so far in August.
Meanwhile, four ETFs explicitly targeting AI and robotics had attracted roughly $2.1 billion combined through late July: ARTY about +$707 million, AIQ +$763 million, CHAT +$384 million, and BOTZ +$232 million, according to data resource ETFCentral.COM.

The gap looks even larger if one includes semiconductors, the infrastructure backbone of the AI boom.
VanEck’s SMH semiconductor ETF alone had taken in $5.42 billion YTD by July, almost matching the entire $5.48 billion withdrawn from spot Bitcoin ETFs this year.

The Wall Street Journal reported this week that retail investors and hedge funds have increasingly shifted money away from cryptocurrencies and toward AI-related stocks and investments.
One investor profiled by the newspaper had exited a six-figure Bitcoin position entirely to concentrate on AI.
Technical Take This Week: Consolidation Above $60,000 or Breakdown Toward $50,000?
Bitcoin’s broader technical structure remains bearish after its bear flag breakdown in June.
The flag formed during BTC’s February-May recovery before price decisively broke below its rising lower trendline. Its measured downside target sits near $50,800, meaning the bearish setup remains active despite Bitcoin stabilizing above $60,000.
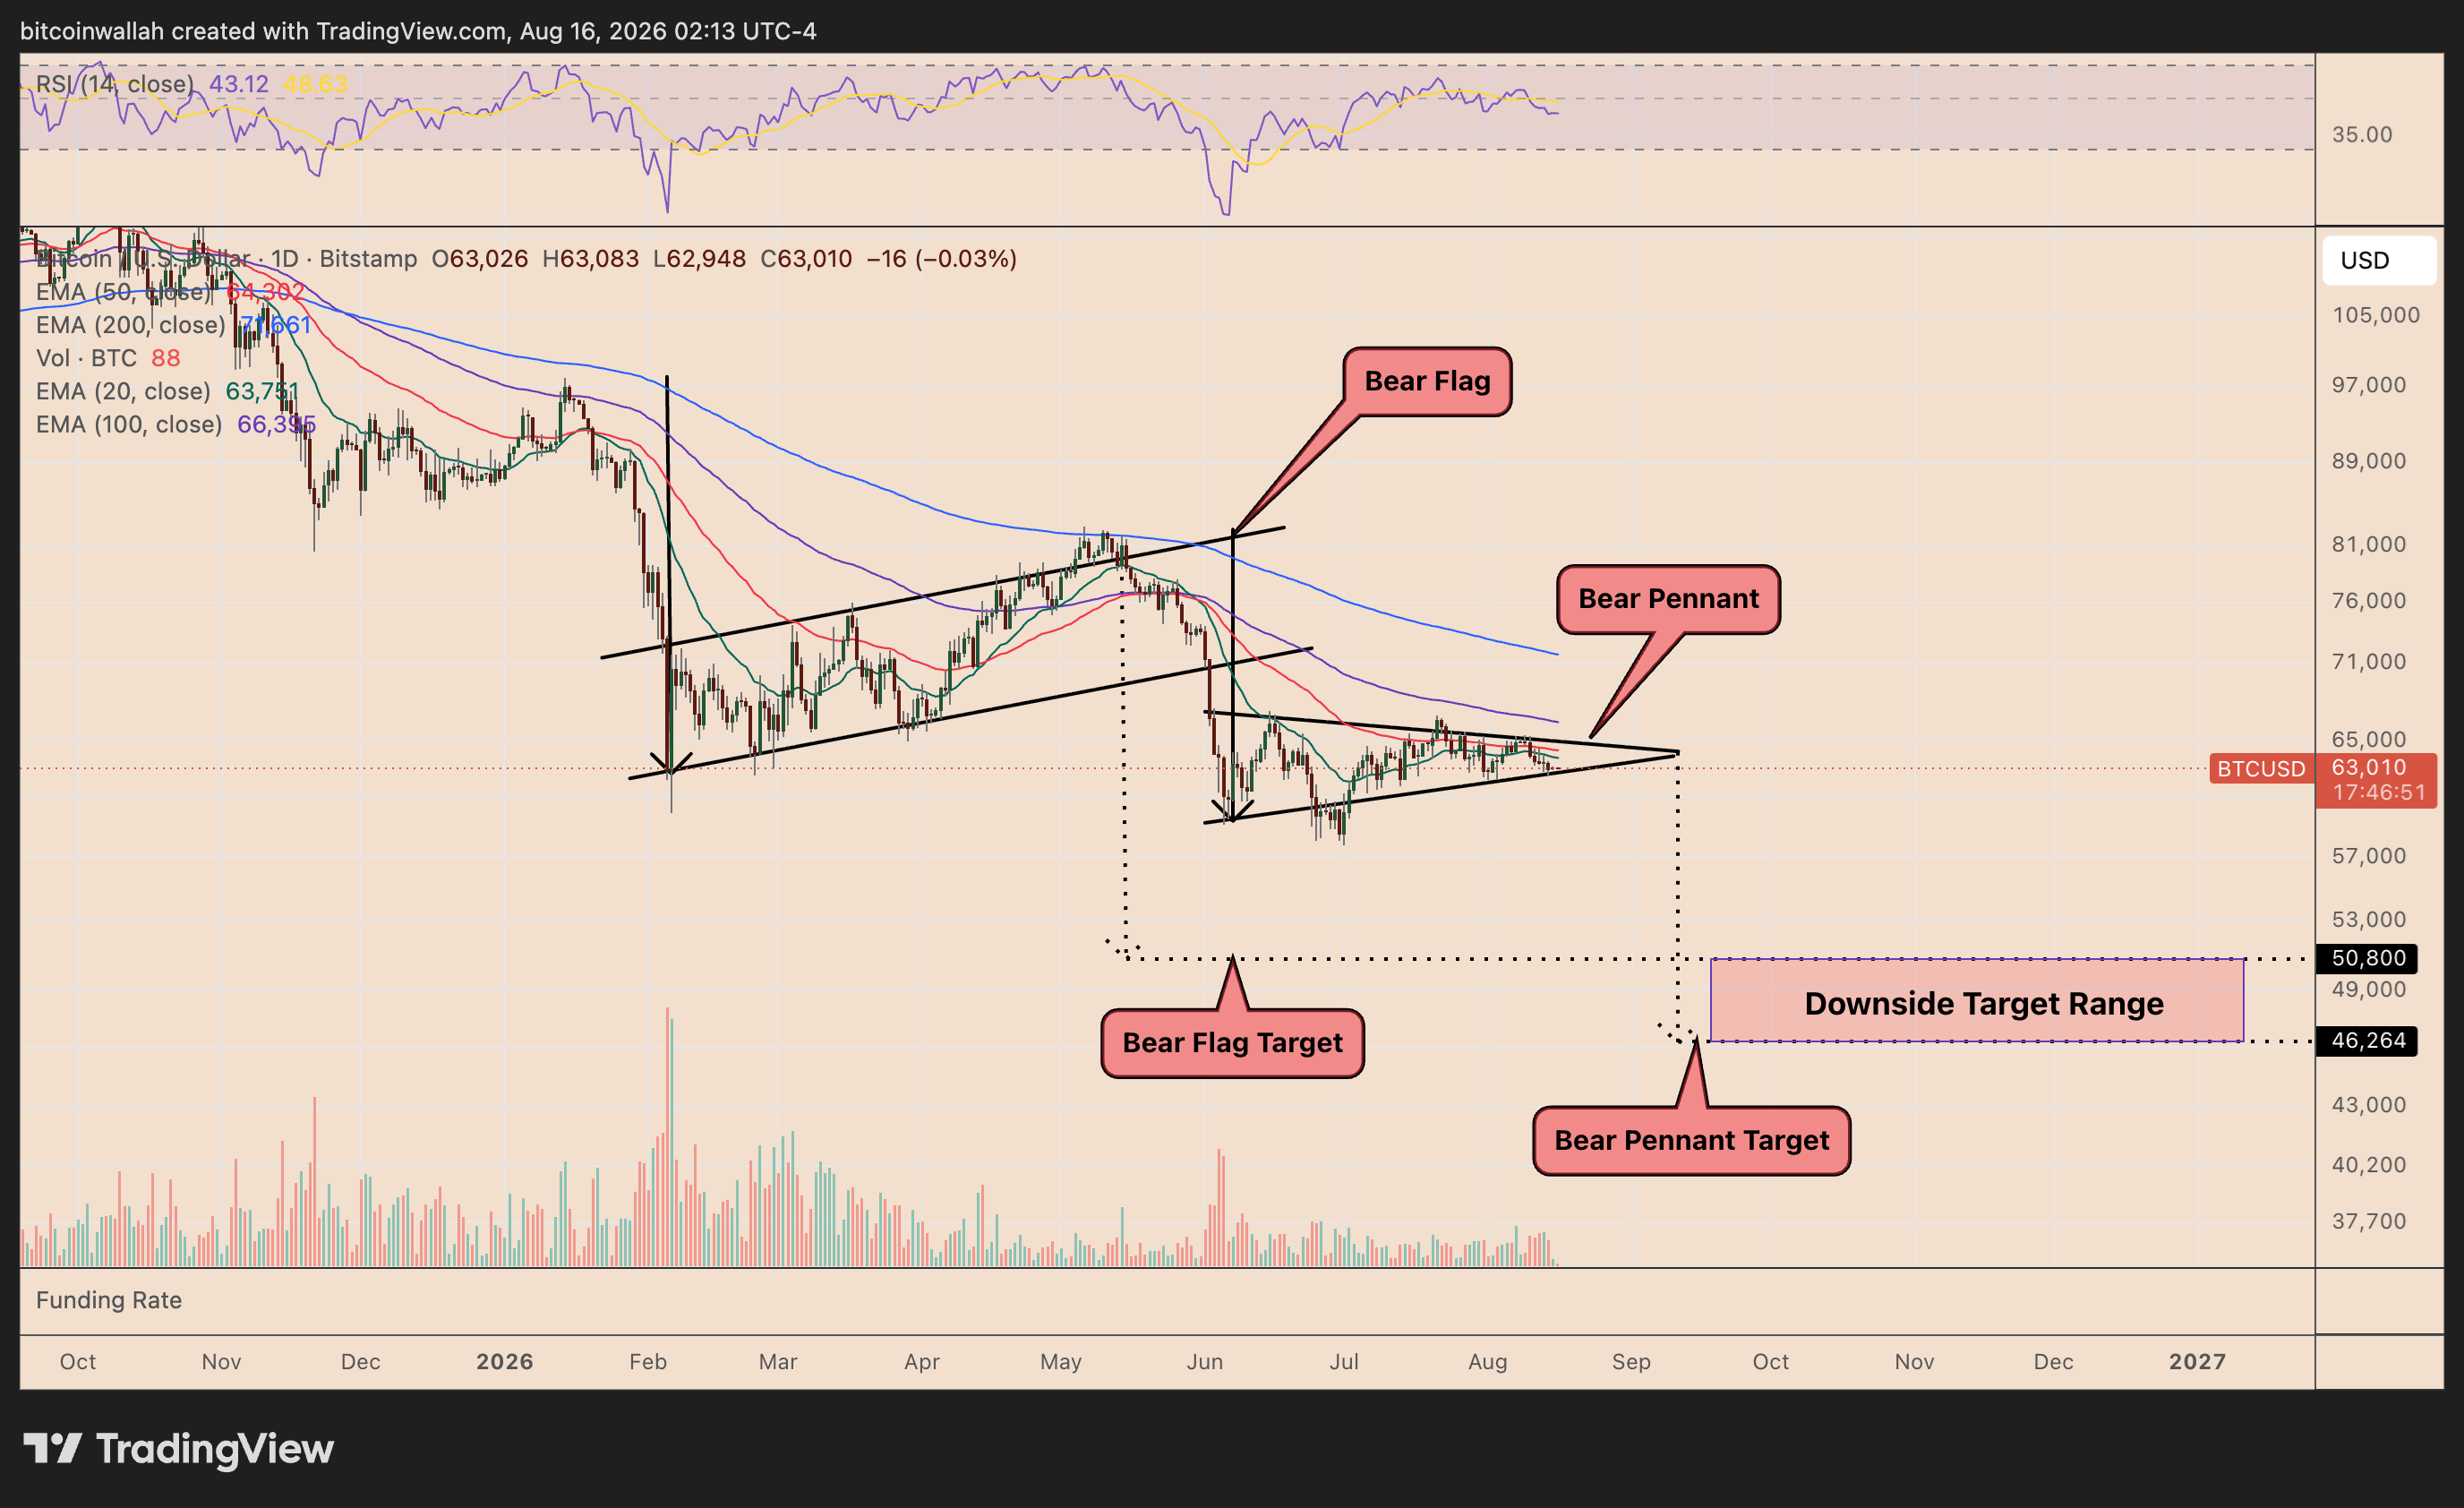
Since the June selloff, BTC has formed a smaller bear pennant around $60,000-$65,000, another bearish continuation pattern.
A decisive break below the pennant’s rising support could accelerate the existing flag breakdown, with the pennant’s measured move pointing toward approximately $46,300.
That puts the broader downside target zone at roughly $46,000-$51,000.