
US Dollar News: Fed Rate Cut Bets Rise as Euro and Pound Navigate Domestic Risks
As of August 14, the U.S. dollar is facing pressure due to changing expectations for the Fed after release of slower inflation data provided further evidence of a case for increased easing. The July report for the Producer Price Index (PPI) indicated that inflation for wholesale goods was unchanged compared to the month prior, and core PPI also increased by 0.2% after the latest CPI report indicated a slower-than-expected rise. The data released further eased the concerns for inflation rising again and suggested that the Fed was likely to begin cutting rates in September.
For the Fed, the labor market is still the most important factor. The recent data for July hiring indicated slower hiring, and more of a need to strike a balance between inflation concerns and an economy likely to be slowing. However, Fed officials reassure the market that the inflation data is still well above the Fed’s target for inflation being set at 2%.
The euro is benefitting from the slower expectations of Fed rate movements, but is also dealing with domestic challenges. The European Central Bank is still maintaining a cautious stance by keeping policy the same as they assess the impact of the disruptions to Middle East energy supply and inflation as well as consumer demand. Recent reports of the activity of the euro zone have shown signs of stabilizing, but still have the potential to grow at a lower level due to slow demand and geopolitical challenges.
Sterling faces considerable pressure as the UK’s second-quarter GDP showed a 0.4% quarterly rise, following stronger early quarter growth. The data published reflects the economy’s resilience, especially as price rises for energy have been high and global uncertainties remain. Still, the Bank of England must continue to balance inflation and the threats caused by the increasing growth of nominal wages and energy price rises.
For currency markets, the most important factor continues to be the difference in interest rates and the expected changes. Easing US inflation has lowered expectations of further rate hikes by the FOMC, and the euro and pound are now being evaluated on whether their respective domestic economies can continue to grow without re-igniting inflation.

U.S. Dollar Index Technical Analysis: DXY Holds 99.40 Support as Bulls Attempt Recovery
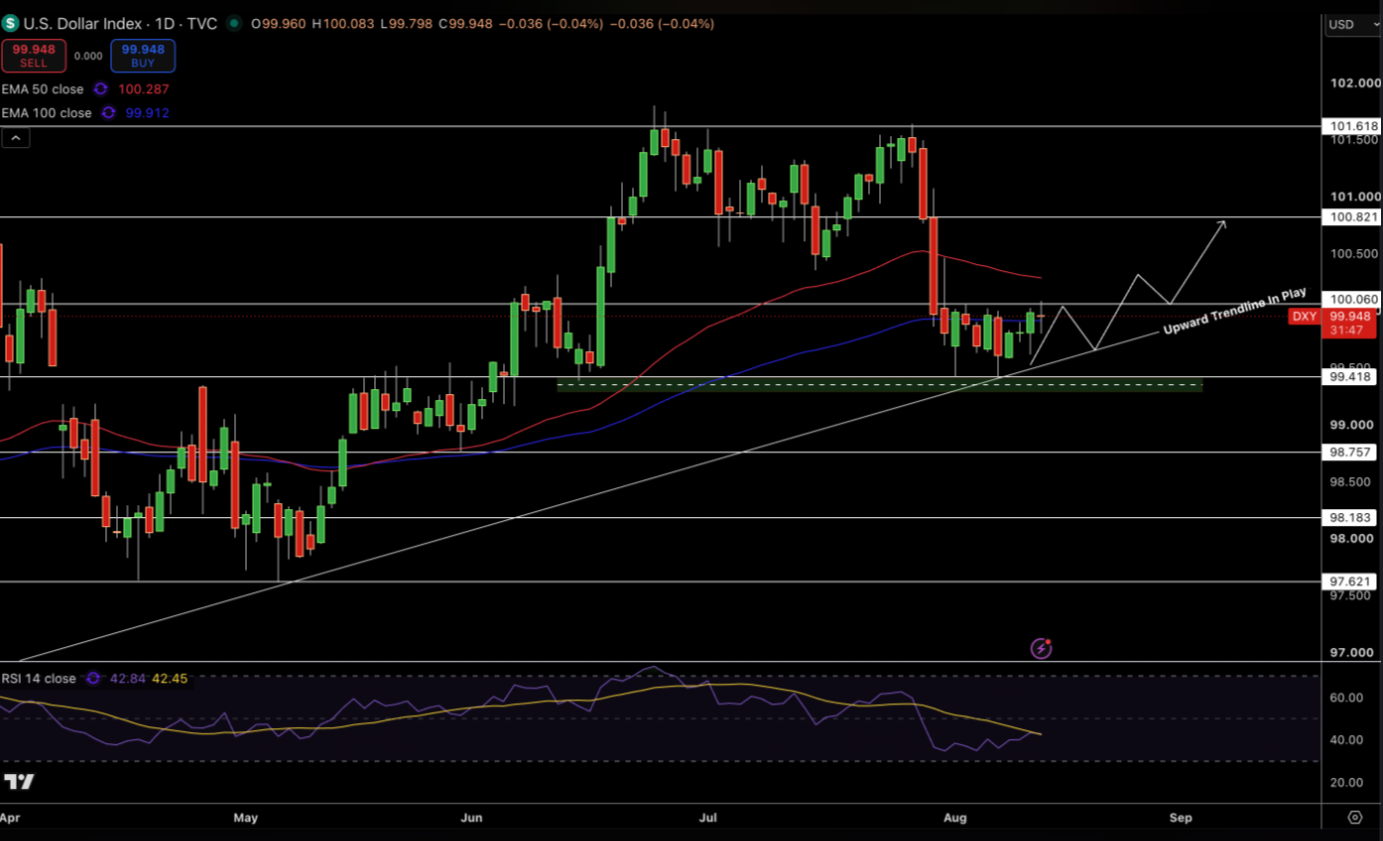
The U.S. Dollar Index is hovering around 99.95, as it stabilized above the significant 99.40 support area. The daily chart depicts DXY still as a sell into the 101.60 area; however, bulls defend the rising trendline which has been a key topside recovering support line since the March lows. The index is currently trading sideways between resistance and support, potentially forming a base and accumulating ahead of a new strong trending move.
Price is just above the 100.00 level, with the 50-day EMA at 100.29 and acting as resistance. The 100-day EMA at 99.91 is currently acting as support and along with the current price makes this area of the market very important. RSI at 42 reflects zero momentum and a low level, but is also neutral and showing signs of the potential beginning of a new recovery if buyers show strength.
Breaking above 100.36 would provide a strong outlook for further recovery to the 100.82 and also 101.61 levels. Below the 99.40 support would lead to a sell off at 98.75 and possibly 98.18. The current outlook maintains a bullish recovery strategy, but is cautious as long as the rising trendline is intact.
EUR/USD Price Forecast
Every new EUR/USD analysis as it publishes, today's technical signal and key levels, live price — on one page.
See all EUR/USD forecastsGBP/USD Technical Analysis: Cable Tests 1.3515 Resistance While Trendline Supports Buyers
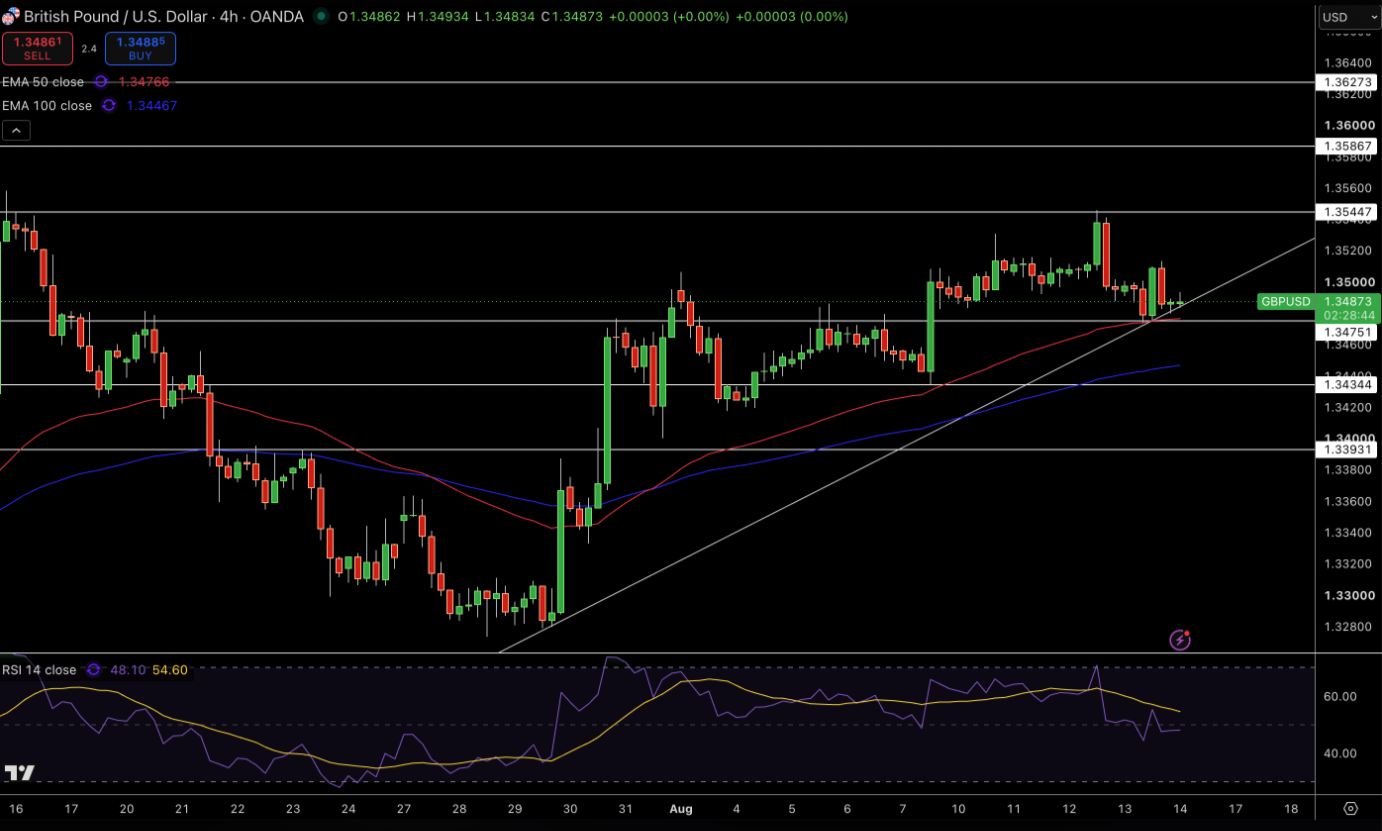
GBP/USD is at 1.3487 after a highly bullish response to the 1.3270 lows. An ascending trendline is currently following the upward structure, with price having trouble breaching the 1.3515 resistance area, which has led to sideways movement in this area.
The 50-day EMA is at 1.3477 and the 100-day EMA is at 1.3446, which puts this pair slightly in favor of bulls. RSI is at 48 and shows that this pair may be losing some of its bullish momentum.
Breaching 1.3515 would show an upward movement with targets of 1.3545 and 1.3586. 1.3437 and 1.3400 offer support. The overall structure is bullish as long as price remains above the trendline. For bulls to resume their momentum, 1.3515 is an important level to take out.
EUR/USD Technical Analysis: Euro Faces Trendline Resistance Near 1.1570
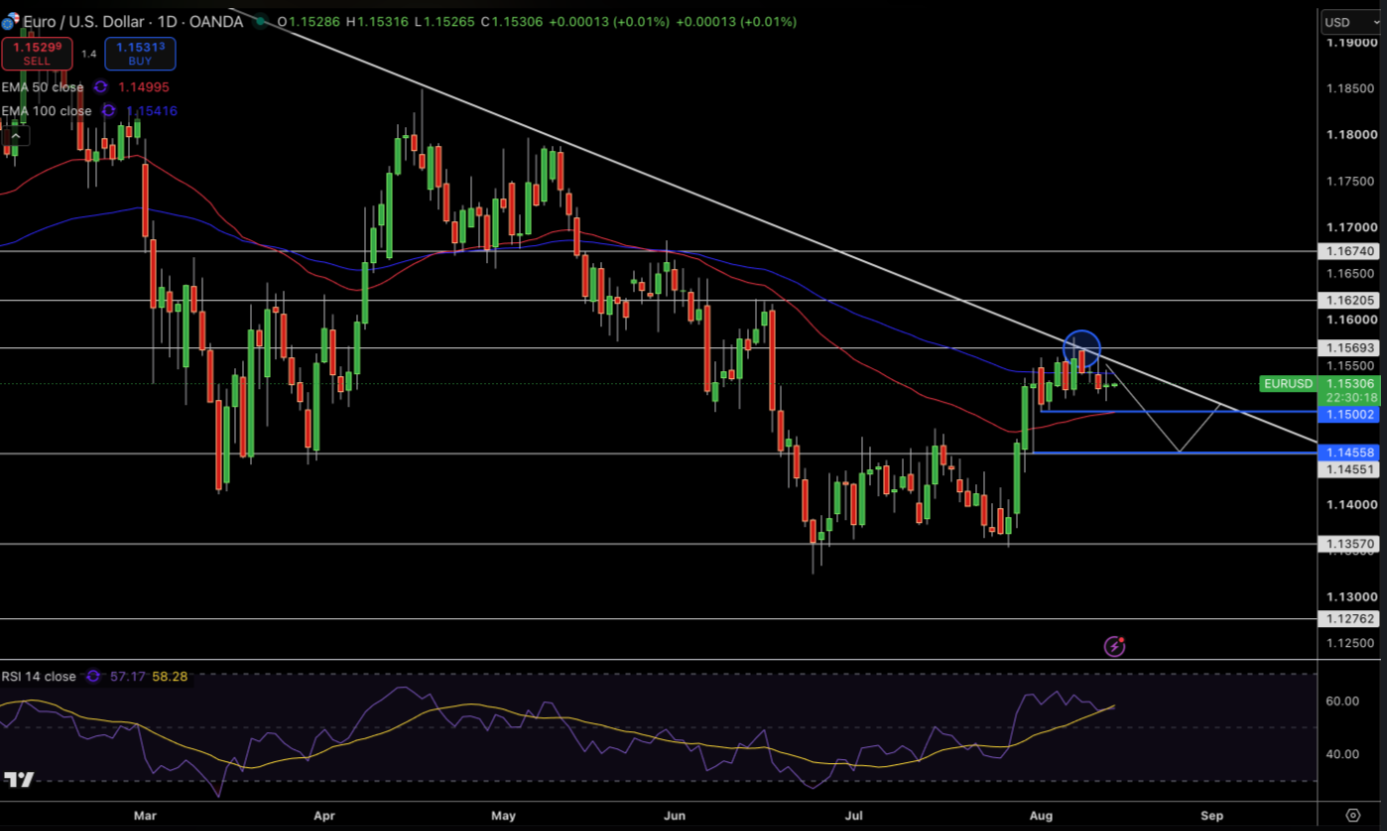
The EUR/USD currency cross currently trades around 1.1530. It has recovered from the 1.1350 July lows, but it’s facing a downward trendline and a resistance zone from the early year highs. The daily chart shows an attempt at recovery, but buyers will need a clear break above the trendline and the 1.1569 level to continue the trend higher.
The cross currently is trading above the 1.1499 50 day moving average and the 1.1541 100 day moving average. This indicates short term momentum is positive, but vague. Further, RSI is at 57, positive but not overbought.
A close above 1.1569 should confirm the breakout and may allow for a move toward 1.1620 and 1.1674. In the opposite direction, the first support is at 1.1500 and falls at 1.1455 and 1.1357. The cross is currently at a pivotal point, and the next move is likely based on if buyers break the long-term downtrend line or if sellers hold the current resistance.