NASDAQ 100 Technical Analysis
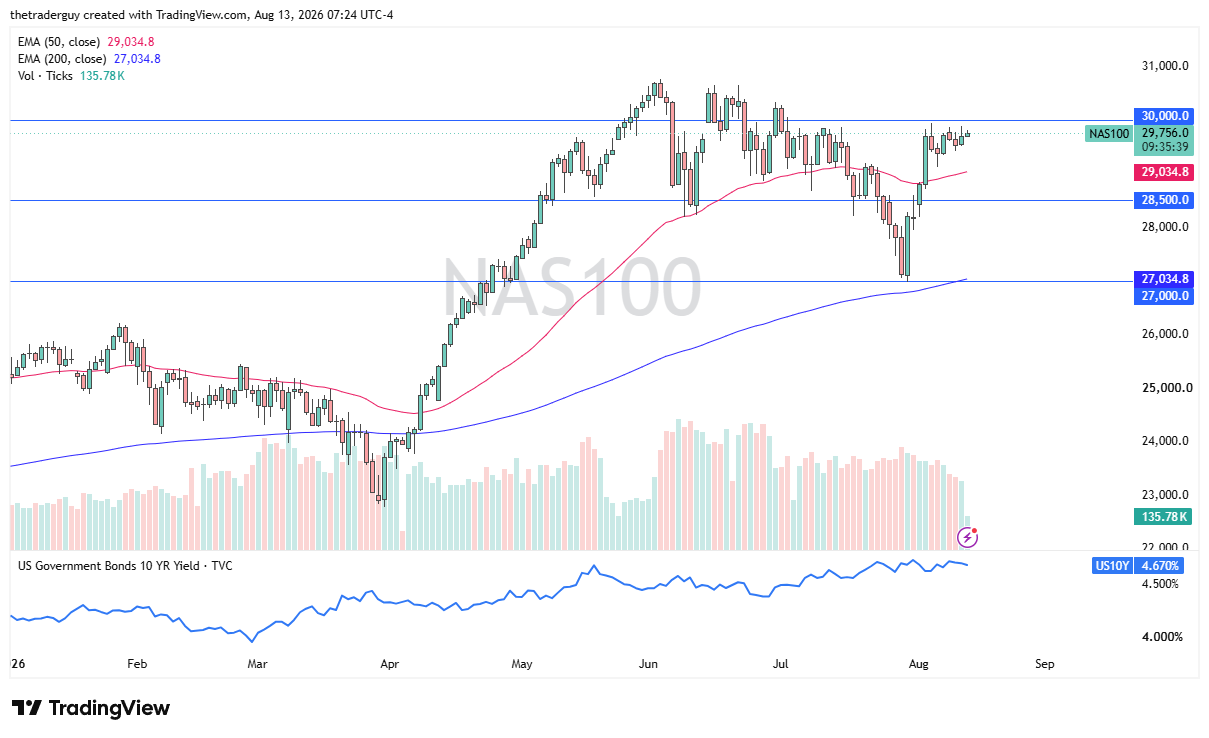
The Nasdaq 100 has rallied just a little bit during the early part of the Thursday session as we continue to see a general upward grind higher.
Ultimately, this is a market that is trying to break above the 30,000 level, and the ascending triangle at the top of a pole—maybe some type of flag—is a good sign from a technical analysis standpoint, but we are in the midst of earnings.

Dow Jones 30 Technical Analysis
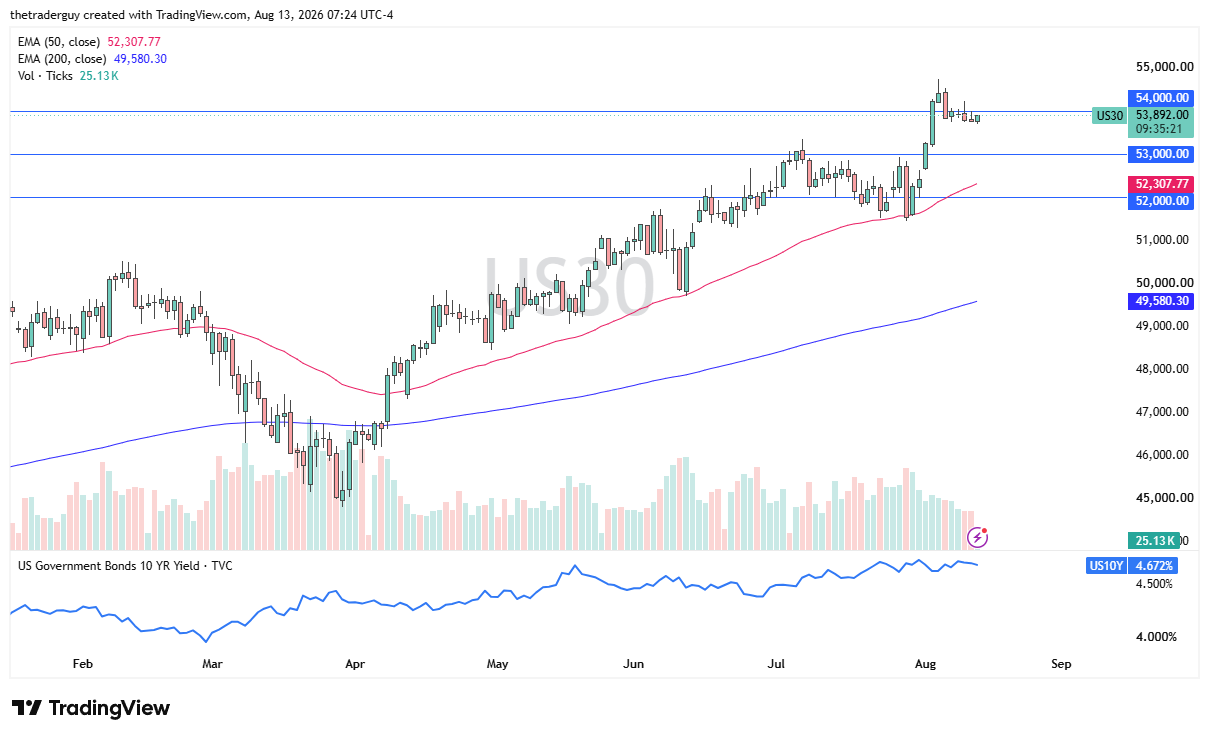
The Dow Jones 30 is sitting just below the 54,000 level. This, of course, is a large round, psychologically significant figure and an area we’ve been hanging around for a minute now.
So with that being the case, it’s likely that the market is just looking for some type of external factor to get moving. We do have PPI a little later; that could be it. We’ll just wait and see, but we’re still very much in an uptrend.
S&P 500 Technical Analysis
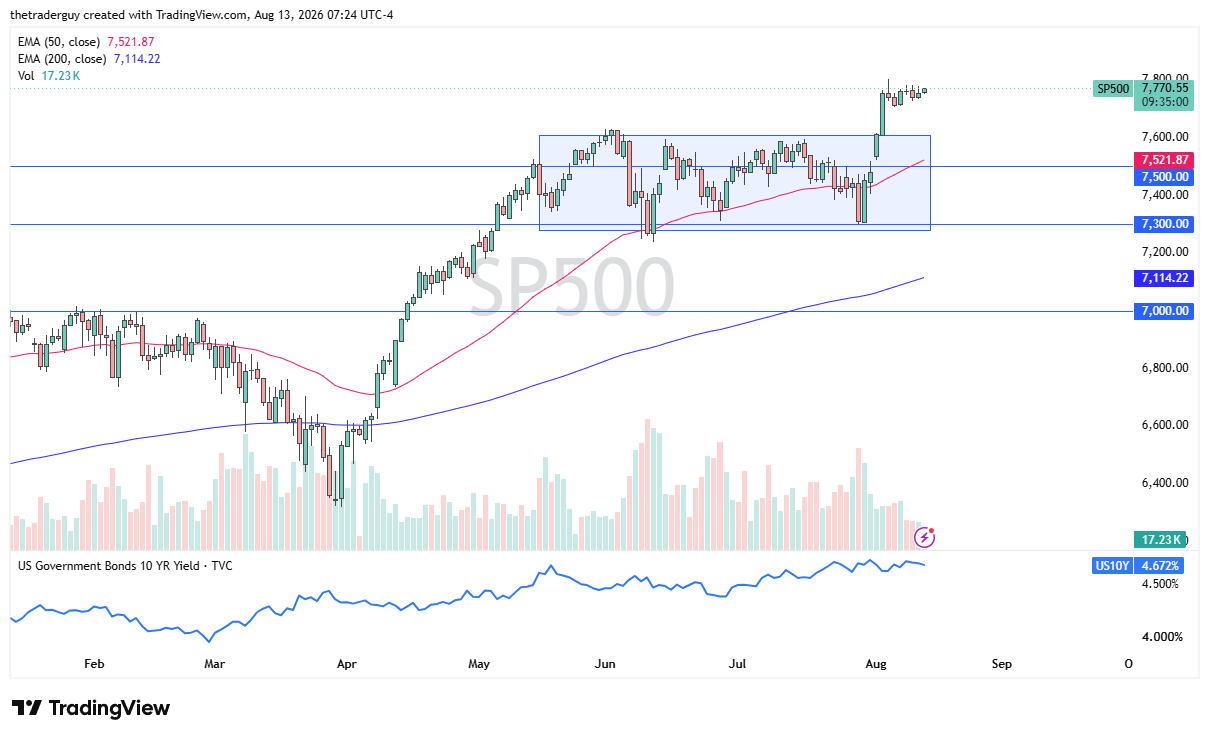
The S&P 500 looks like it is trying to rally a bit in the early part of the trading session. If we can clear the 7800 level, that could kick off an attempted completion of the measured move from the previous consolidation, which was to the 7900 level.
Ultimately, there’s really not much in this chart that tells me the S&P 500 is something that is struggling. It looks pretty good here. And, of course, PPI could be a factor. Perhaps traders continue to see foreign inflows into the United States, some of the highest amounts of inflows we’ve seen in ages. Therefore, the S&P 500 would be a beneficiary, all things being equal.
S&P 500 Price Forecast
Every new S&P 500 analysis as it publishes, today's technical signal and key levels, live price — on one page.
See all S&P 500 forecastsIf you’d like to know more about chart patterns and how to trade them, please visit our educational area.