NASDAQ 100 Technical Analysis
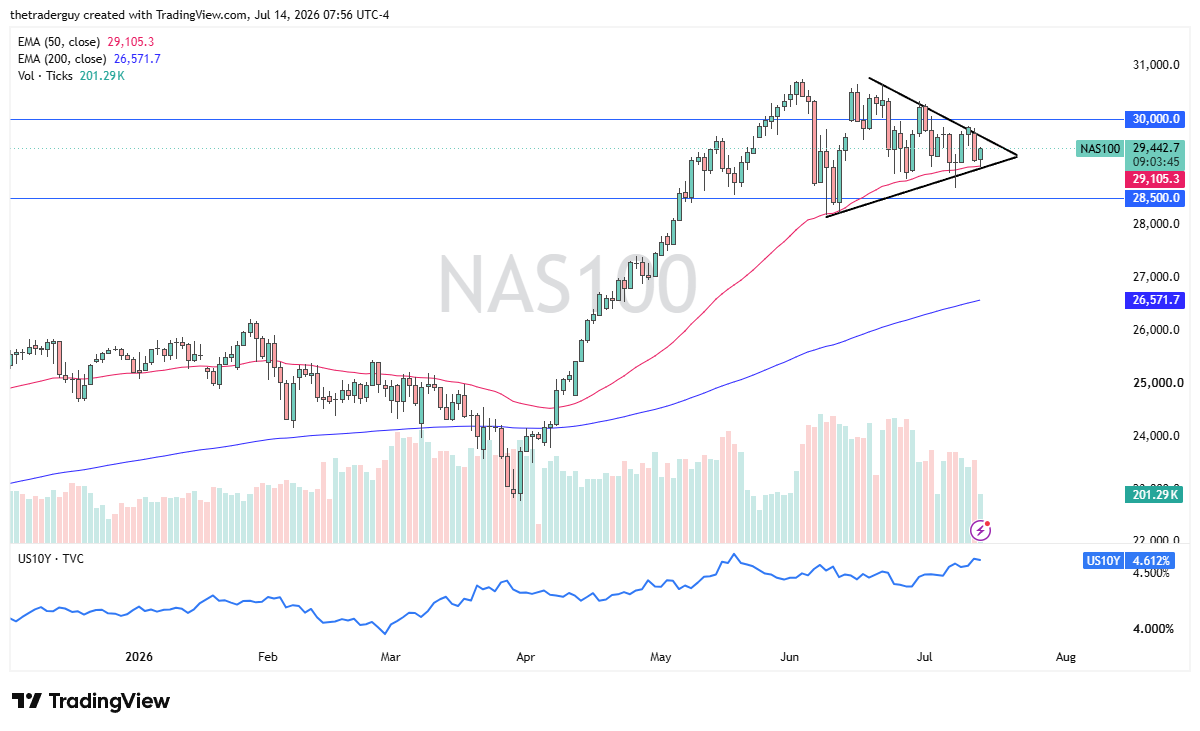
The Nasdaq 100 has bounced a bit from the 50-day EMA, an indicator that, recently, at least has acted a bit like a trend line. The question at this point in time will be whether or not the interest rate markets are going to have an influence here. They did start to bring rates down a little bit in pre-market trading, so I think you have to ask yourself whether or not that is actually going to matter.
It will be interesting to see how this plays out. It looks like over the last couple of weeks, markets have been consolidating, which is common after a massive move, as we saw earlier in the year. The question is when or if we will get some type of momentum. We are starting to look a bit choppy, and that does make sense with the geopolitical noise.

Dow Jones 30 Technical Analysis
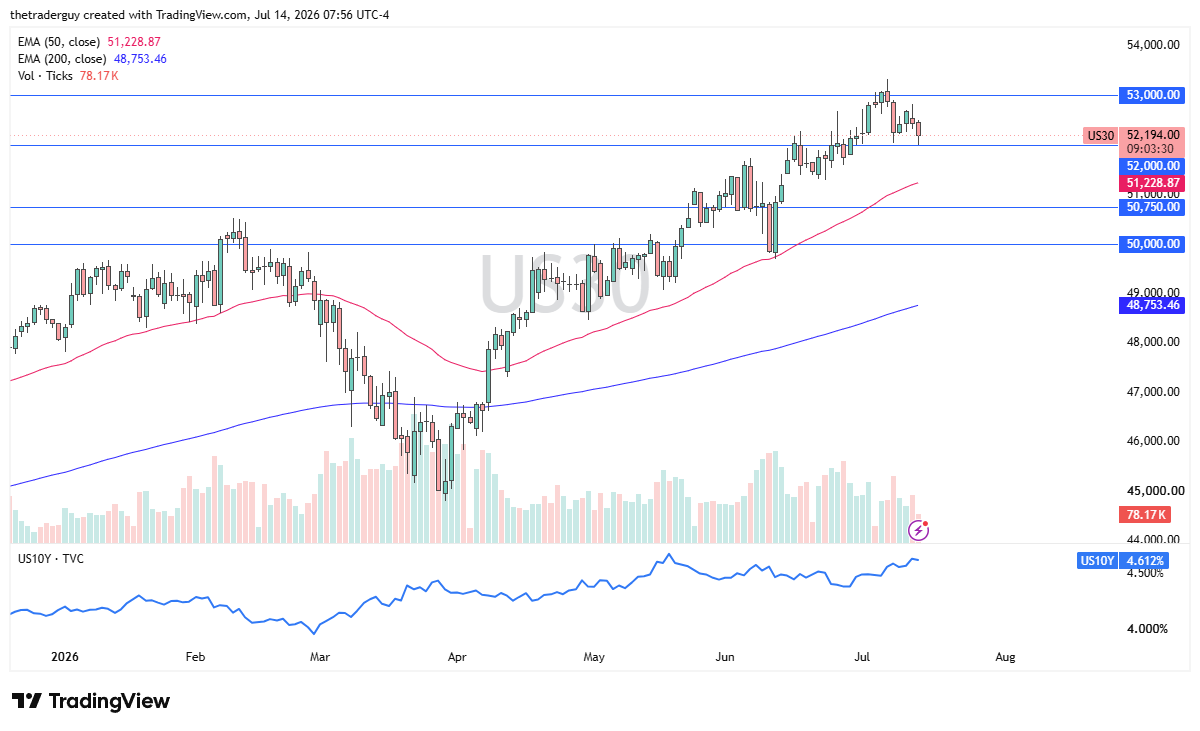
The Dow Jones 30 dropped initially during the trading session, but the 52,000 level has offered a little bit of support. I will be watching this very closely because this is an area that I think will matter, at least in the short term, as historically speaking, at least there has been market memory here. The overall trend is still positive, so for myself, I look for buying opportunities and do not have any interest in shorting. The Dow Jones 30 has shown itself to be very stable over the last several months, even in its drawdowns, so it is a place that I look to hide from volatility at times.
S&P 500 Technical Analysis
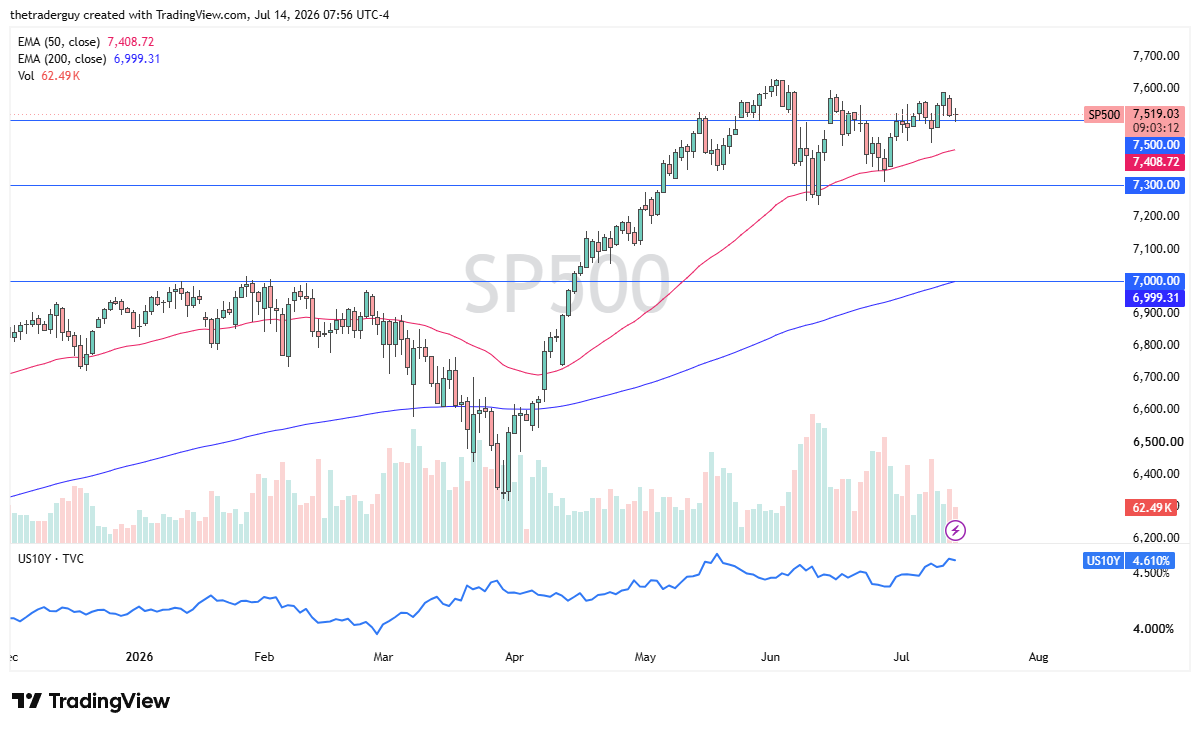
The S&P 500 is very choppy and sideways in early trading on Tuesday, using the 7,500 level as support. There is also the 50-day EMA underneath, which had acted a bit like a trend line previously. It will be interesting to see if we drop, if that ends up holding. So far, though, the S&P 500 looks pretty stable, relatively quiet considering all of the things that you would think could cause chaos. After all, the Americans and the Iranians are shooting at each other again, and in the past, that meant big moves. Right now, it seems very much like a market that is just waiting around, trying to figure out what to do as it is near all-time highs.
If you’d like to know more about chart patterns and how to trade them, please visit our educational area.