Banks Beat but CPI Owns Tuesday
Dow futures dropped 196 points, or 0.37%, Tuesday morning. S&P 500 futures slipped 0.10%. Nasdaq futures bucked the trend, up 0.42%, as chip stocks bounced back from Monday’s rout.
The banks already delivered before the bell. Bank of America and Wells Fargo both cleared expectations and JPMorgan Chase beat on the numbers. But nobody is trading earnings this morning. The June CPI print and Warsh’s first Congressional testimony as Fed Chair land this afternoon and those two catalysts own the rest of the session.
Daily September E-mini S&P 500 Index Futures Technical Analysis
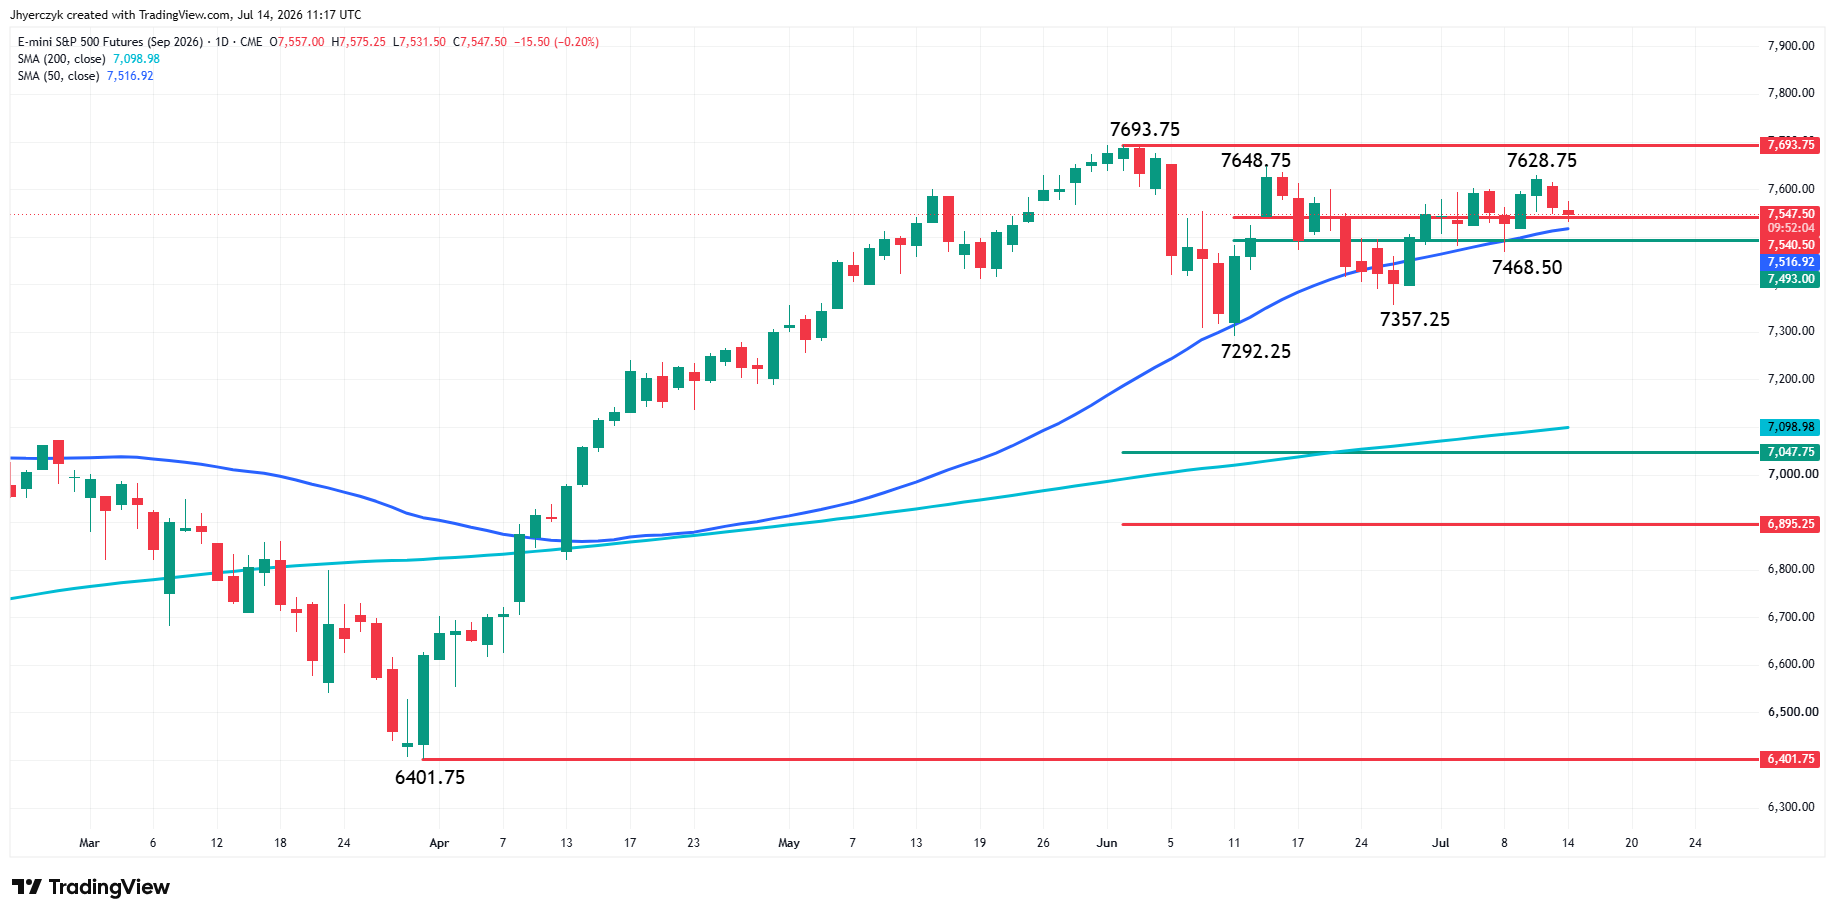
September E-mini S&P 500 Index futures are drifting lower early Tuesday. Today’s price action has turned 7628.75 into a new main top to go along with additional main tops at 7648.75 and 7693.75. A series of higher bottoms are providing support at 7468.50, 7357.25 and 7292.25.
The swing chart indicates that the swing tops and swing bottoms are forming a compressing triangle formation, which typically indicates trader indecision and impending volatility. They are expecting either a melt-up or a melt-down.
Holding above the short-term retracement zone at 7540.50 to 7493.00 and the 50-day moving average at 7516.94 is indicating a slight upside bias.
For the bulls, it all comes down to sustaining the move over the support and creating the upside bias needed to overcome the swing tops. So, essentially were looking at a combination of strong bidding to prop up the index and the aggressive taking out of offers to trigger the breakouts needed to make a new all time high.
For the bears, the selling needs to be strong enough to take out support with above average volume to bring in the short-sellers. This could then fuel a cascading breakdown under the three main bottoms. If the index goes into full correction mode then look for the move to extend into the 200-day moving average at 7099.03 and the long-term retracement zone at 7047.75 to 6895.25.
Dow Jones Price Forecast
Every new Dow Jones analysis as it publishes, today's technical signal and key levels, live price — on one page.
See all Dow Jones forecastsDaily September E-mini Nasdaq-100 Index Futures Technical Analysis
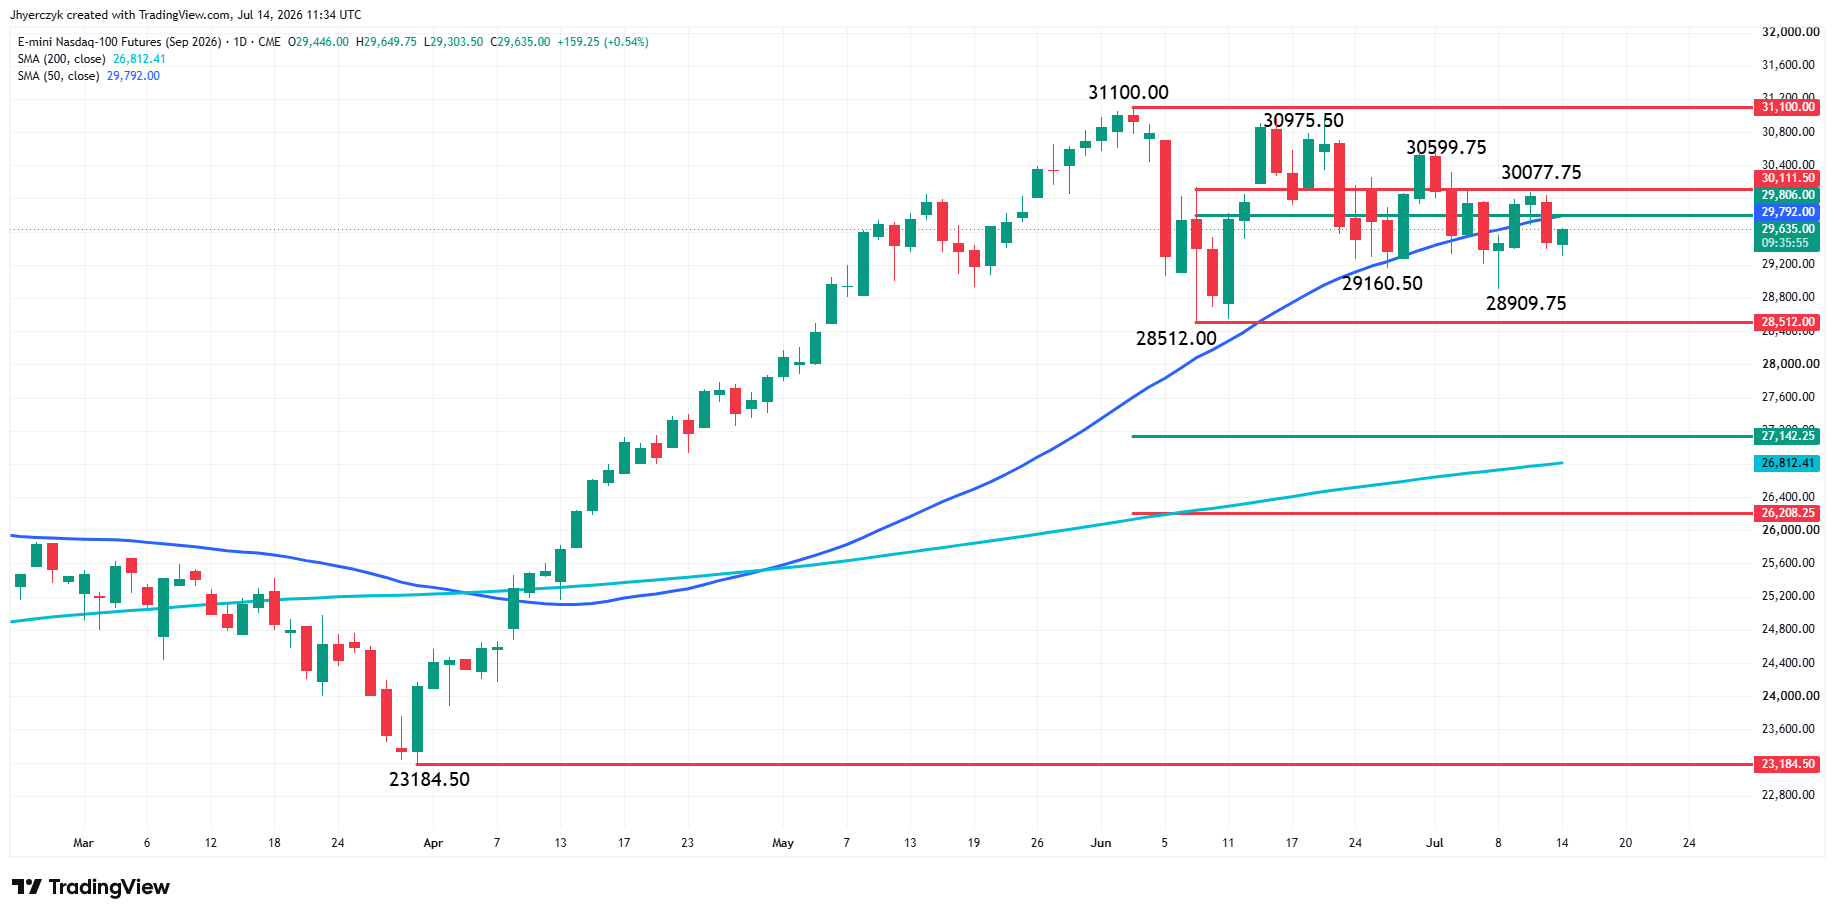
September E-mini Nasdaq-100 Index futures are edging higher in Tuesday premarket session. This comes after the formation of another swing top at 30077.75 to go along with additional lower tops at 30599.75, 30975.50 and the all-time high at 31100.00.
Besides the series of main tops, the market is being capped by the 50-day moving average at 29792.04 and a short-term retracement zone at 29806.00 and 30111.50.
If Monday’s weakness returns today, aggressive sellers will try to press the index into a pair of swing bottoms at 28909.75 and 28512.00. The latter is a potential trigger point for an acceleration to the downside with the major target the long-term retracement zone at 27142.25 to 26208.25. Inside this zone is the 200-day moving average at 26812.53.
Daily September E-mini Dow Jones Industrial Average Technical Analysis
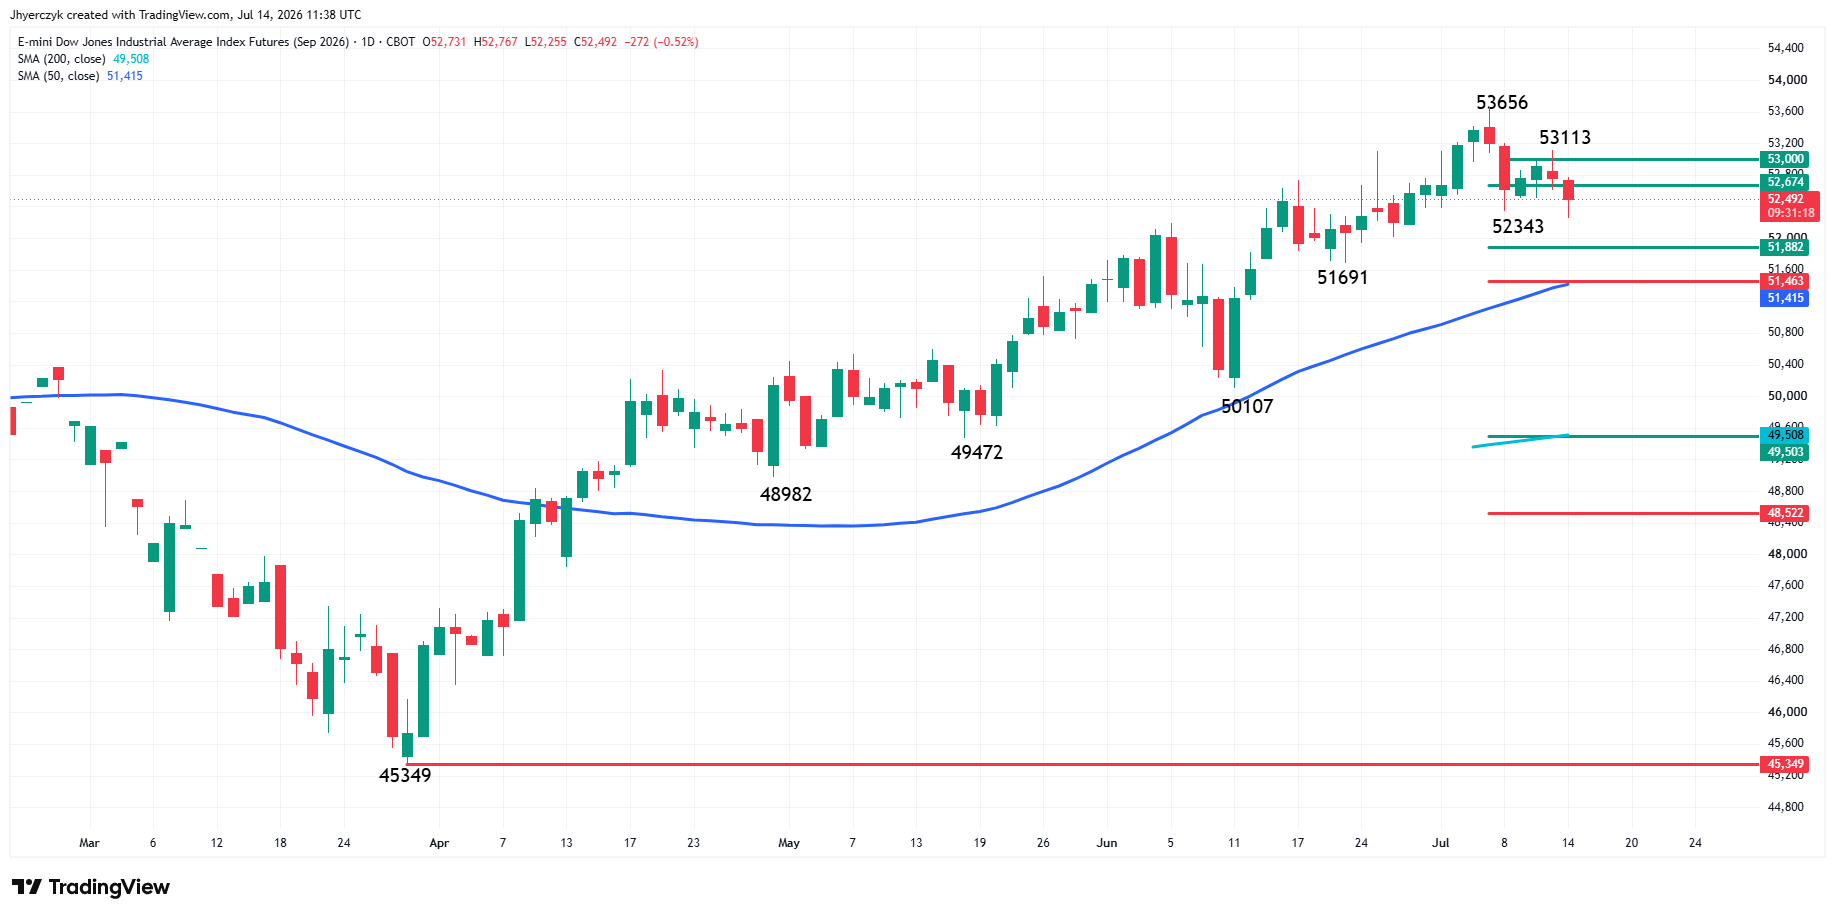
September E-mini Dow Jones futures are trading lower early Tuesday after posting a potentially bearish secondary lower top at 53113. Today’s pre-market selling also pierced the previous swing bottom at 25343. If the selling pressure resumes during the cash market session, downside momentum could drive Dow futures into a short-term retracement zone at 51882 to 51463 and the 50-day moving average at 51415.
On the upside, overcoming the pair of 50% levels at 52674 and 53000 will signal the return of buyers. They will try to create the momentum needed to take out the swing top at 53113. This would put the record high at 53656 back on the radar.
CPI Lands With Crude Already Running
Economists expect June CPI to show annual inflation dropping to 3.8% from 4.2% in May with core holding at 2.9%. Those forecasts were built before crude ran above $80 per barrel this week. U.S. crude held above that level Tuesday morning after the Hormuz escalation kept the pressure on overnight. The 10-year Treasury yield climbed to around 4.62% ahead of the print.
Warsh testifies the same afternoon. First appearance before Congress as Fed Chair and he walks in with crude at the highs and yields already moving. A hot CPI number in that setup makes any patience message impossible to sell.
Stocks in the News
Bank of America beat on earnings and revenue, edging higher in premarket. Wells Fargo also cleared expectations, up more than 1%. JPMorgan Chase posted better-than-expected numbers but slipped slightly before the open.
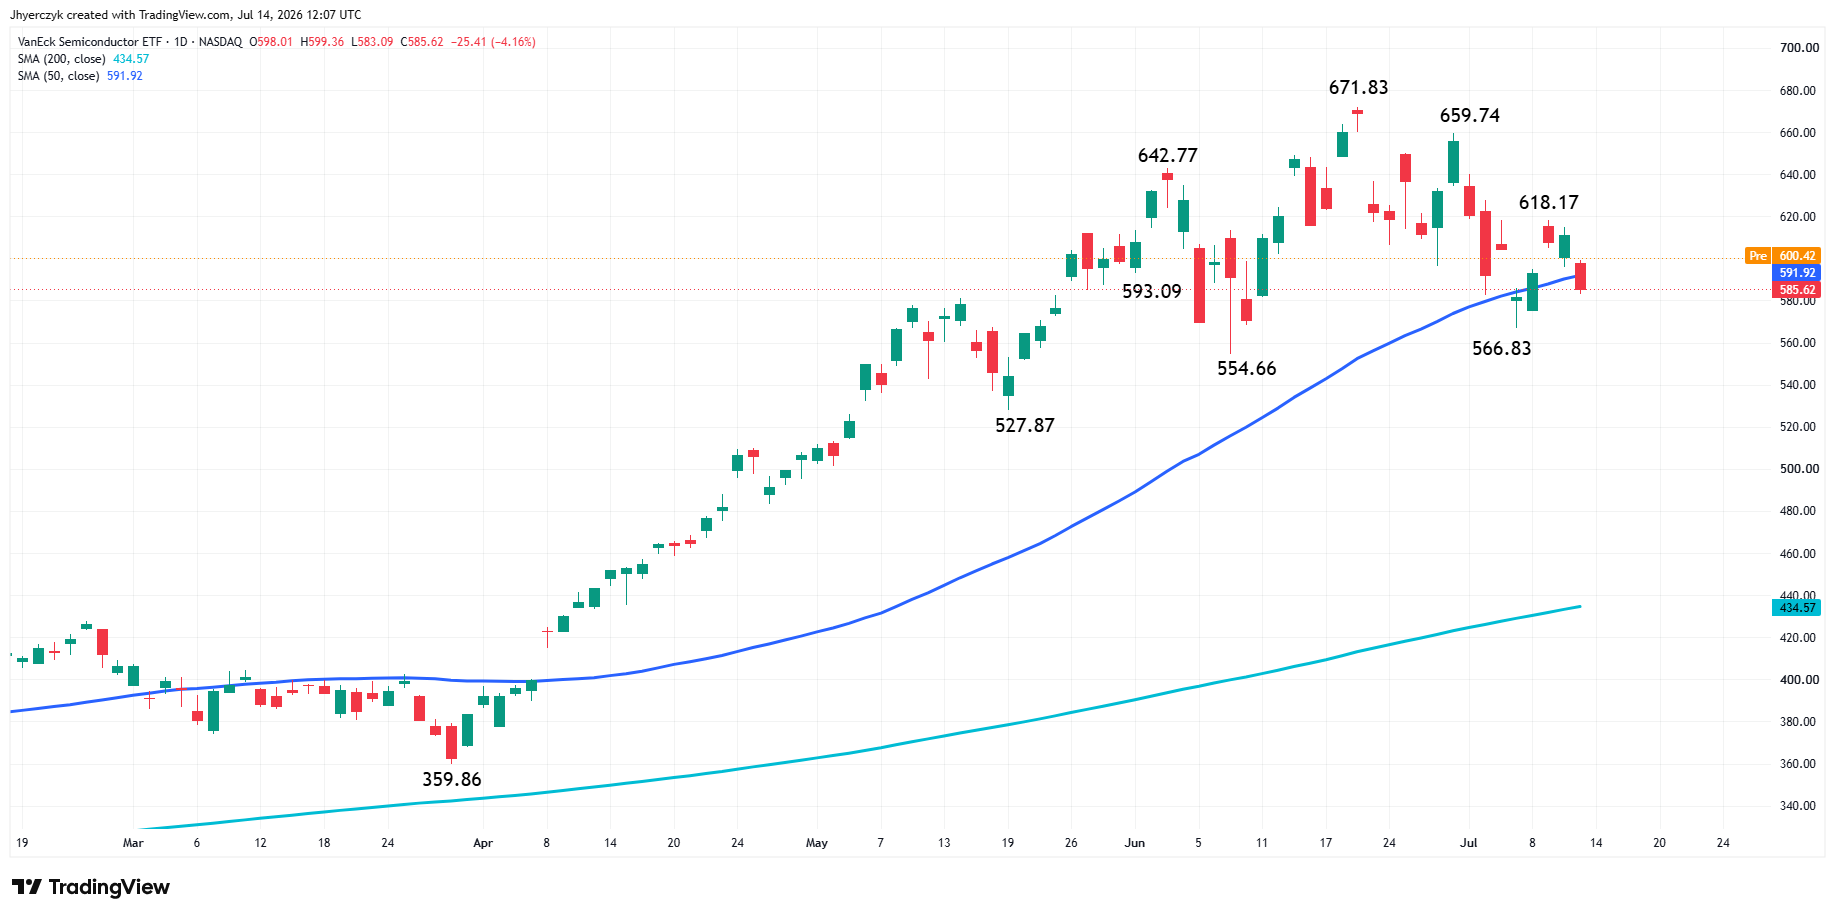
The VanEck Semiconductor ETF climbed nearly 2% as chips bounced from Monday’s selloff. Applied Materials, Lam Research, STMicroelectronics, Teradyne, and Micron all posted premarket gains.
What to Watch
The June CPI number decides whether Tuesday’s early strength survives the afternoon. If inflation cooperates, the market has room to run into the back half of earnings week. If the print runs hot with crude still running, Warsh has no cover and the rate trade takes over.
The S&P 500 is compressing into a triangle and that formation breaks one way or the other this week. The Nasdaq-100 needs to reclaim its 50-day moving average to confirm Monday’s selling was the flush and not the start of something bigger. The Dow already cracked its swing bottom in premarket and if that level fails in the cash session the short-term retracement zone is the next stop.
More Information in our Economic Calendar.