
Advertisement
Advertisement
WTI Crude Oil Forecast December 6, 2016, Technical Analysis
Updated: Dec 6, 2016, 09:25 GMT+00:00
WTI Crude Oil The WTI Crude Oil market rallied on Monday yet again as we broke towards the $52 level. This is a market that is trying to break out, and I
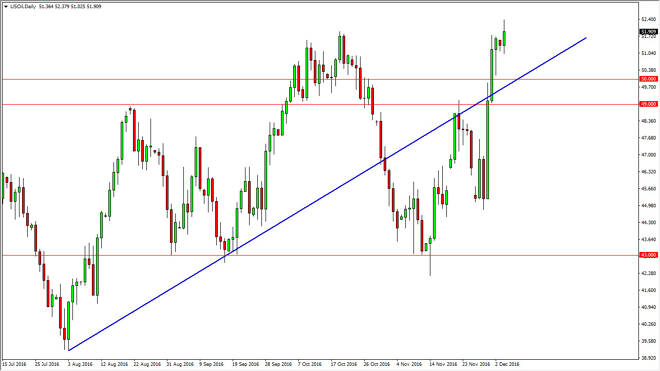
WTI Crude Oil
The WTI Crude Oil market rallied on Monday yet again as we broke towards the $52 level. This is a market that is trying to break out, and I believe there is a significant amount of support all the way down to the $50 level. A pullback from here could find plenty of support below, but I would wait for some type of daily candle to trust the supportive candle. The previous uptrend line should offer support, just as the vital $50 level in that area. Because of this, I think that it will be very difficult to break down below there, so if we did do so, that would be an extraordinarily bearish sign. A break above the top of the candle for the session on Monday is a strong sign as well, but we also recognize that the market is a bit overextended.
Brent
Brent markets rallied and broke to a fresh, new high during the day on Monday, as we continue to reach towards the $55 level. I would suspect that a pullback is probably necessary in this area, because just a couple of days ago, we were down at the $47 level. This is a very strong market now, but I think we need a pullback to find support. There is plenty of support just underneath, so I feel that the market will find plenty of buyers, especially down near the uptrend line that has been supporting this market for some time. Ultimately, this is the market reacting to an OPEC induced production cut, so it makes sense that we have the market reacting as we, but I also recognize that the oversupply will continue regardless of what OPEC does, because they do not have the power to turn off American or Canadian or even Mexican drillers. Ultimately, the demand simply isn’t there, so while it is a short-term bullish market, sooner or later reality comes crashing back down and into the market, pushing us much lower and back towards the $51 handle below.
About the Author
Christopher Lewisauthor
Chris is a proprietary trader with more than 20 years of experience across various markets, including currencies, indices and commodities. As a senior analyst at FXEmpire since the website’s early days, he offers readers advanced market perspectives to navigate today’s financial landscape with confidence.


Advertisement