The big-data +Insights analytical tool leverages the Plus500 user base of millions, providing unique ideas you can integrate into your trading strategy.
Plus500 blazed a trail by including Traders’ Sentiment data on its platform, showing the percentage of clients that are long (buyers) or short (sellers) for each instrument. Traders’ Sentiment provides powerful insight into the psychology of a market. Traders can interpret the data in a variety of ways. Most commonly, it is understood that when a disproportionate percentage of traders are either long or short an instrument, this can serve as a powerful indicator of a potential reversal.
•80% of retail investor accounts lose money when trading CFDs with this provider. You should consider whether you can afford to take the high risk of losing your money.
+Insights draws deeper from Plus500’s cutting-edge technology and large client base. The new tool uses data from over 23 million registered customers across 50 countries to show real-time and historical trading trends across nine major categories.
Plus500’s +Insights tool is available on its flagship WebTrader platform and Android and iOS mobile apps.
From the WebTrader platform, +Insights can be selected from the left navigation menu, as shown above.
The tool allows users to track the behavior of Plus500 traders by pulling up top ten lists based on the following categories:
Three main filters can be applied to the results:
The +Insights tool analyzes and aggregates millions of data points in real time to help guide clients in their trading decisions. The results enable traders to determine which instruments are ‘in play’ for a specific period and identify potential trading ideas.
For example, at the time of this writing, +Insights shows that Natural Gas, Germany 40, and Oil are the most traded instruments on the hourly time frame. The most actively traded instruments typically see greater volatility and may move in a trending fashion, which provides greater opportunities for traders.
The screenshot above shows the +Insights tool displaying the Most Profit-Making Positions over the past 7 days, across all instruments and all Plus500 traders globally.
Being able to see where traders are getting it right (most profit-making positions and highest profit return from a trade) and wrong (most loss-making positions and highest loss return from a trade) can be very useful in generating trading ideas.
While features such as most profit-making positions allow clients to piggyback on the best trading ideas of successful clients, the tool can also be used for contrarian strategies. For example, by looking for an extreme imbalance of buyers and sellers within the results of the most bought and most sold lists of instruments.
Traders’ Sentiment data and Buy and Sell buttons are conveniently built into the +Insights results pages.
Further data is available when you pull up an individual instrument to trade and select the +Insights tab.
Under the Plus500 Traders’ Activity heading, a banner draws from +Insights trends data to show how the instrument performs relative to other instruments. For example, the screenshot above shows that gold was the third most traded commodity over the past 24 hours.
Beneath this, the Traders’ Trends section shows the number of views the instrument received globally over the past 24 hours. The popularity indicator shows how many positions traders opened in the last six hours compared to the same timeframe of the previous 21 days. This indicator is updated hourly.
Scrolling down, you can see indicators relating to news.
The Crowd’s Impression section shows how traders feel about an instrument, ranging from very positive to very negative.
The +Insights tool within the Plus500 mobile app has all the same features, allowing traders to access the data on the go.
Since the web platform is so minimalistic in its design, the mobile equivalent is easy to navigate and delivers a great user experience.
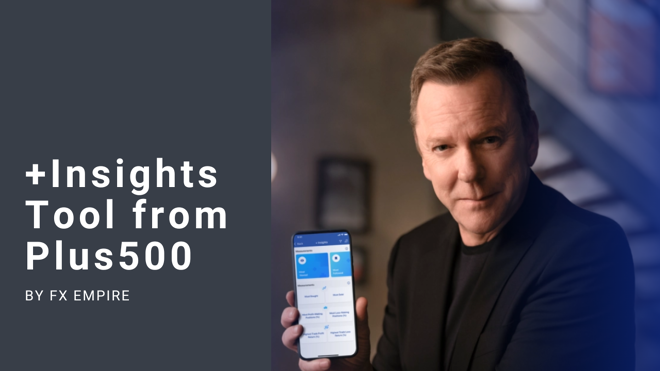
The image above shows various panels within the mobile app related to the +Insights tool:
+Insights is not a ‘black box’ giving precise buy and sell signals. The value of the tool is in identifying instruments that are likely to be worth looking at through the lens of your own unique trading strategy.
In a world of generic platforms and third-party tools, Plus500 sets itself apart with its proprietary technology. The big-data, analytical +Insights tool further establishes the company as a global leader in CFD brokerage and fintech.
Starting his career in finance on the floor of the Chicago Mercantile Exchange, Dan later gained insight into the forex industry during his time as a Series 3 licenced futures and forex broker. Dan also traded at a couple of different prop trading firms in Chicago.