
Advertisement
Advertisement
10-Yr U.S. Treasury Notes (TY) Futures Technical Analysis – August 13, 2015 Forecast
By:
September 10-Year U.S. Treasury Notes are trading lower shortly before the cash market opening. The weakness is a continuation of the selling pressure
September 10-Year U.S. Treasury Notes are trading lower shortly before the cash market opening. The weakness is a continuation of the selling pressure which began on Wednesday. The strong reversal in the U.S. equity markets helped encourage the selling.
Overnight, the People’s Bank of China intervened for the third time this week, however, the muted response suggests that currency, equity and commodity markets have stabilized. This diminishes the chance of a flight-to-safety rally by T-Notes.
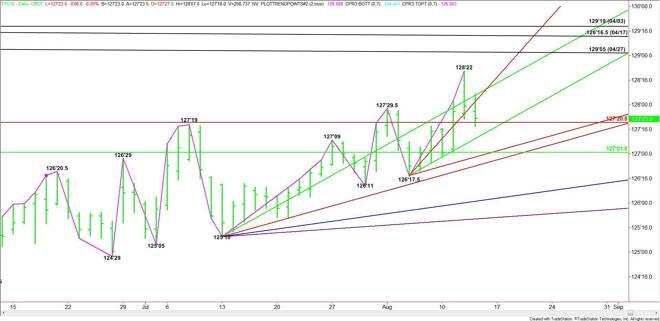
Technically, the main trend is up according to the daily swing chart. However, momentum shifted to the downside when a pair of uptrending support angles were taken out with conviction earlier in the session. These angles at 128’01.5 and 128’06 are new resistance. Overcoming 128’06 will put T-Notes in a bullish position once again.
A sustained move over 128’06 could trigger an acceleration into the minor top at 128’22. Taking out this level with conviction could fuel a breakout into 129’05, the April 27 top.
Earlier in the session, T-Notes found support on a major Fibonacci level at 127’20.5. A trade through this level cold trigger a move into a short-term uptrending angle at 127’09.5. The daily chart opens up to the downside under this level with the next targets a major 50% level at 127’01 and an uptrending angle at 126’29.5
Based on the early price action, the direction of the market during the regular session is likely to be determined by trader reaction to the Fib level at 127’20.5.
Traders should look for increased volatility following the release of the latest U.S. Retail Sales data and this week’s unemployment claims.
About the Author
James Hyerczykauthor
James Hyerczyk is a U.S. based seasoned technical analyst and educator with over 40 years of experience in market analysis and trading, specializing in chart patterns and price movement. He is the author of two books on technical analysis and has a background in both futures and stock markets.


Advertisement