
Advertisement
Advertisement
10-Yr U.S. Treasury Notes (TY) Futures Technical Analysis – August 17, 2015 Forecast
By:
September 10-Year U.S. Treasury Notes are trading slightly better shortly before the cash market opening. The main trend is up on the daily swing chart,
September 10-Year U.S. Treasury Notes are trading slightly better shortly before the cash market opening. The main trend is up on the daily swing chart, but momentum is to the downside.
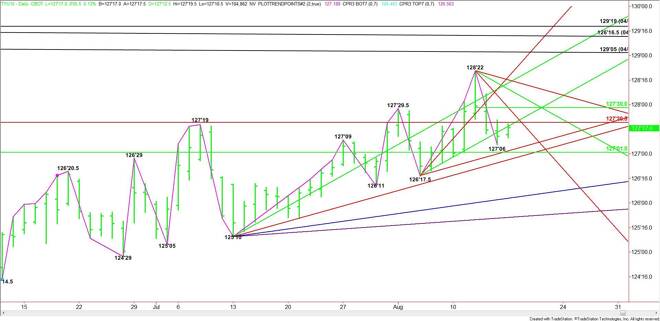
Last week’s low at 127’06 is the first minor target. The best downside target is the support cluster at 127’01.5 to 127’01. This is followed by a longer-term uptrending angle at 126’28. A trade through this angle will be a sign of weakness.
The market could accelerate to the down side under 126’28 with the next target a main bottom at 126’17.5. A trade through this level will turn the main trend to down according to the daily swing chart.
On the upside, overcoming an uptrending angle at 127’17.5 and a long-term Fib level at 127’20.5 will signal the presence of buyers. This could trigger a rally into a resistance cluster at 127’30. This is the best upside target.
Overcoming 127’30 with conviction could trigger a further rally into another downtrending angle at 128’10.
Based on the current price at 127’17, the direction of the market the rest of the session will be determined by trader reaction to 127’20.5. The best upside target is 127’30. The best downside target is 127’01.
About the Author
James Hyerczykauthor
James Hyerczyk is a U.S. based seasoned technical analyst and educator with over 40 years of experience in market analysis and trading, specializing in chart patterns and price movement. He is the author of two books on technical analysis and has a background in both futures and stock markets.


Advertisement