
Advertisement
Advertisement
10-Yr U.S. Treasury Notes (TY) Futures Technical Analysis – August 26, 2015 Forecast
By:
September 10-Year U.S. Treasury Notes are called lower shortly before the cash market opening. The main trend is up according to the daily swing chart,
September 10-Year U.S. Treasury Notes are called lower shortly before the cash market opening. The main trend is up according to the daily swing chart, but momentum has shifted to the downside due to Tuesday’s sharp sell-off.
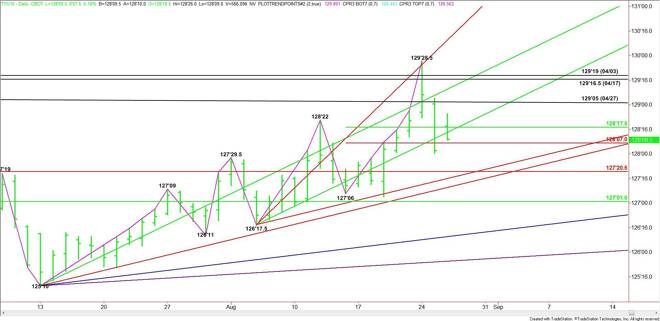
Earlier in the week, sellers stopped a rally at 129’29.5. This price was slightly above a pair of previous tops at 129’19 and 129’16.5. These prices are all new resistance today.
The subsequent sell-off under 129’05 created enough downside momentum to takeout potential support at 128’17.5 and 128’13.5. These prices are also new resistance.
On the downside, the first support is a short-term Fibonacci level at 128’07. The daily chart opens to the downside under this level with the next potential target a major Fibonacci level at 127’20.5. A pair of uptrending angles at 127’15.5 and 127’10 are also major downside targets. The market could collapse to the downside if 127’10 fails today.
Based on the current price at 128’09.5, look for a bullish tone to develop on a sustained move over 128’17.5 and a bearish tone to develop on a sustained move under 128’07.
In my opinion, T-Notes are even riskier than the stock market due to severely overbought conditions and are vulnerable to the downside. A rebound rally in the equity markets could trigger a steep drop today. Another hard sell-off by stocks will likely trigger another flight-to-safety rally. However, if T-Notes diverge from stocks then look out below.
About the Author
James Hyerczykauthor
James Hyerczyk is a U.S. based seasoned technical analyst and educator with over 40 years of experience in market analysis and trading, specializing in chart patterns and price movement. He is the author of two books on technical analysis and has a background in both futures and stock markets.


Advertisement