
Advertisement
Advertisement
10-Yr U.S. Treasury Notes (TY) Futures Technical Analysis – August 27, 2015 Forecast
By:
September 10-Year U.S. Treasury Notes are trading flat shortly before the cash market opening. Based on the close at 127’29, the nearest support is a
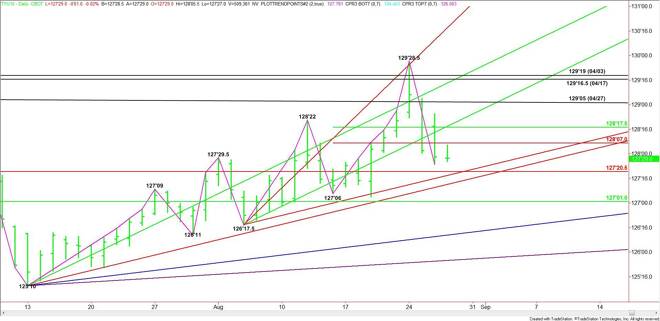
September 10-Year U.S. Treasury Notes are trading flat shortly before the cash market opening. Based on the close at 127’29, the nearest support is a major Fibonacci level at 127’20.5. This is followed by a pair of uptrending angles at 127’17.5 and 127’12.
The daily chart opens up under 127’12 with the next target a main bottom at 127’06. A trade through this bottom will turn the main trend to down on the daily swing chart. This could trigger a fast move into the major 50% level at 127’01.
T-Notes are vulnerable to a steep break under 127’01 with the next targets a main bottom at 126’17.5 and a long-term uptrending angle at 126’11.
Based on the current price at 127’29, the first upside target is a minor Fib level at 128’07. This is followed by a minor 50% level and uptrending angle at 128’17.5. Overcoming this price cluster will put the market in a strong position to continue the rally.
T-Notes are still under the influence of the stock market. If stocks continue to firm then look for T-Notes to weaken. The recent rally by T-Notes suggests the move may have been overdone to the upside. This has put the futures contract in an extremely vulnerable position.
About the Author
James Hyerczykauthor
James Hyerczyk is a U.S. based seasoned technical analyst and educator with over 40 years of experience in market analysis and trading, specializing in chart patterns and price movement. He is the author of two books on technical analysis and has a background in both futures and stock markets.


Advertisement