
Advertisement
Advertisement
10-Yr U.S. Treasury Notes (TY) Futures Technical Analysis – October 1, 2014 Forecast
By:
December 10-Year U.S. Treasury Notes posted another inside day on Tuesday, indicating trader indecision and impending volatility. This chart pattern could
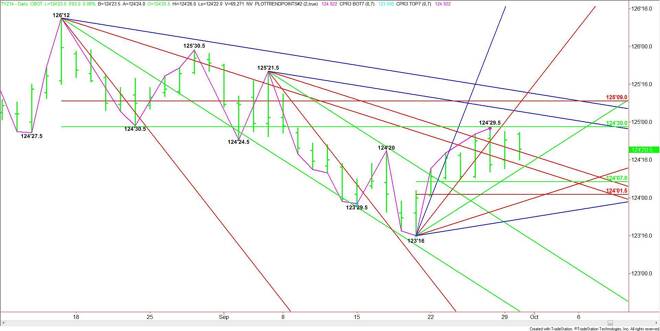
December 10-Year U.S. Treasury Notes posted another inside day on Tuesday, indicating trader indecision and impending volatility. This chart pattern could be indicating an explosive move, but the direction isn’t clear at this time because of the market’s reaction to a major 50% level.
The main range is 126’12 to 123’16. The retracement zone formed by this range is 124’30 to 125’09. Last week, the market stopped at 124’29.5 and formed a potentially bearish closing price reversal top. This chart pattern hasn’t been confirmed yet, meaning traders still don’t know which why they want to take the T-Notes.
If traders take out the reversal top at 124’29.5 and the 50% level at 124’30 then look for a fast rally into the downtrending angle a t 125’03.5. Additional upside targets are the Fibonacci level at 125’09 and another major downtrending angle at 125’12. A pair of main tops at 125’21.5 and 125’30.5 are also potential targets.
On the downside, slipping below 124’17.5 will be a sign of weakness, but the selling pressure is not likely to come in until the uptrending angle at 124’16 is taken out. Taking out another downtrending angle at 124’12 should lead to more selling pressure.
The short-term range is 123’16 to 124’29.5. If the selling pressure persists, the market may eventually break back into its retracement zone at 124’07 to 124’01.5. An uptrending angle from 123’16 at 124’00 forms a potential support cluster with 124’01.5.
There are a lot of numbers to watch today but that’s because of the tight range. Ignoring all the angles and just focusing on the retracement levels, a breakout over 124’30 should lead to a test of 125’09. A breakdown under 124’16 should trigger a break into at least 124’07 to 124’01.5.
About the Author
James Hyerczykauthor
James Hyerczyk is a U.S. based seasoned technical analyst and educator with over 40 years of experience in market analysis and trading, specializing in chart patterns and price movement. He is the author of two books on technical analysis and has a background in both futures and stock markets.


Advertisement