
Advertisement
Advertisement
10-Yr U.S. Treasury Notes (TY) Futures Technical Analysis – October 21, 2014 Forecast
By:
December 10-Year U.S. Treasury Notes closed higher on Monday while managing to stay within the uptrending channel chart pattern. The early session
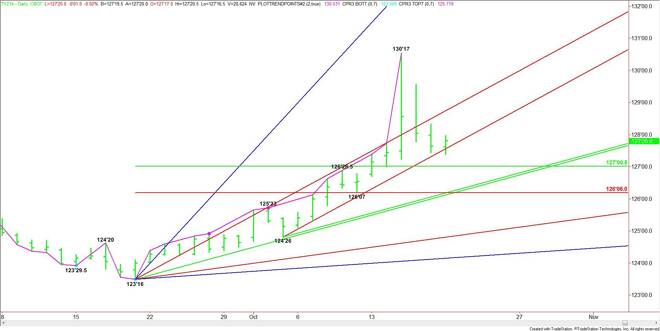
December 10-Year U.S. Treasury Notes closed higher on Monday while managing to stay within the uptrending channel chart pattern. The early session sell-off shows that the market almost finishing retracing last week’s upside spike day range of 127’07.5 to 130’17.
Traders should continue to monitor the U.S. equity markets for clues on direction and volatility. A sell-off in the equity markets is likely to underpin the T-Notes. A stock market rally will be bearish for the T-Notes.
The nearest support is the bottom of the channel at 127’26. This is right where the market closed so look for a flat opening.
The main range is 123’16 to 130’17. If 127’26 fails as support then look for the weakness to continue into the retracement zone of this range at 127’00.5 to 126’06.
A pair of uptrending Gann angles at 126’10 and 126’08 passes through the retracement zone making them valid downside targets.
Holding the bottom of the channel at 127’26 will give the market a friendly tone. The top side of the channel at 129’00 is a valid target, but the market will get there only if there is a hard sell-off in the equity markets.
Watch the price action and order flow at 127’26. This will tell you which way traders want to go today. Keep an eye on the equity market action also for clues.
About the Author
James Hyerczykauthor
James Hyerczyk is a U.S. based seasoned technical analyst and educator with over 40 years of experience in market analysis and trading, specializing in chart patterns and price movement. He is the author of two books on technical analysis and has a background in both futures and stock markets.


Advertisement