
Advertisement
Advertisement
10-Yr U.S. Treasury Notes (TY) Futures Technical Analysis – October 8, 2014 Forecast
By:
December 10-Year U.S. Treasury Notes surged through the last resistance angle before the August 15 top at 126’12. If the upside momentum continues today
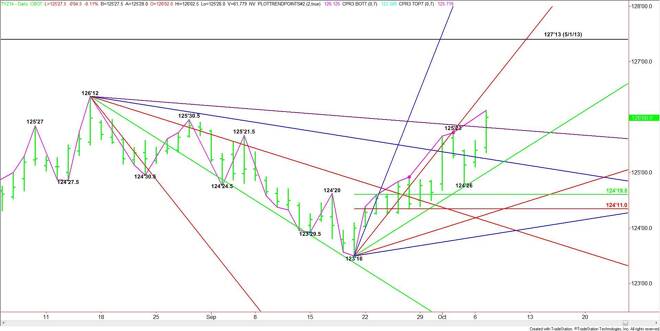
The technical picture looks bullish but traders have to remember that the market is being driven by a news event, which is the sell-off in the stock market. This means that despite the strong rally and near breakout, T-Note traders are taking their cues from the equities. If stocks continue to sell-off in a volatile matter then look for the rally to continue. If stocks stabilize and rally then watch for a retracement to the downside.
If the upside momentum continues then look for a test of the steep uptrending angle at 126’24. Crossing to the bullish side of this angle could trigger an even further rally into the May 1, 2013 top at 127’13.
A failure to take out 126’12 with conviction, or a failed breakout over this price will be a sign of selling pressure. The next sign will be a break under the downtrending angle at 125’25.5 today. This could trigger an even steeper break into a possible support cluster at 125’07 to 125’04.
Look for a possible bullish tone if 126’12 is taken out with conviction or a possible sell-off if T-Notes break below 125’25.5.
About the Author
James Hyerczykauthor
James Hyerczyk is a U.S. based seasoned technical analyst and educator with over 40 years of experience in market analysis and trading, specializing in chart patterns and price movement. He is the author of two books on technical analysis and has a background in both futures and stock markets.


Advertisement