
Advertisement
Advertisement
30-Yr U.S. Treasury Bonds (US) Futures Technical Analysis – October 27, 2014 Forecast
By:
December 30-Year U.S. Treasury Bonds posted an inside day on Friday, but the close was flat. Both are signs of trader indecision and impending volatility.
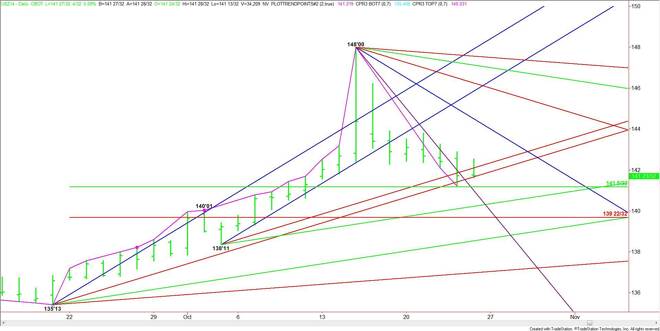
The main range is 135’13 to 148’00. The retracement zone formed by the range is 141’05 to 139’22. The main trend is up on the daily chart which may explain why buyers came in at 141’07 late last week, slightly above the 50% level at 141’05.
The daily chart indicates there is room to the downside if 141’05 fails as support. The next potential target is an uptrending angle at 140’11, followed by the Fibonacci level at 139’22.
The two areas to watch on the upside are a pair of uptrending angles at 141’29 and 142’11. Overcoming these angles will mean that buyers are coming in to support the market. A sustained move over these angles could trigger the start of a near-term retracement to the upside.
The tone of the market today is likely to be determined by trader reaction to the 50% level at 141’05.
About the Author
James Hyerczykauthor
James Hyerczyk is a U.S. based seasoned technical analyst and educator with over 40 years of experience in market analysis and trading, specializing in chart patterns and price movement. He is the author of two books on technical analysis and has a background in both futures and stock markets.


Advertisement