
Advertisement
Advertisement
30-Yr U.S. Treasury Bonds (US) Futures Technical Analysis – October 5, 2014 Forecast
By:
December 30-Year U.S. Treasury Bonds had an interesting trading session on Friday. Firstly, traders drove the market lower after the release of the
December 30-Year U.S. Treasury Bonds had an interesting trading session on Friday. Firstly, traders drove the market lower after the release of the better-than-expected U.S. Non-Farm Payrolls report, confirming Thursday’s closing price reversal bottom.
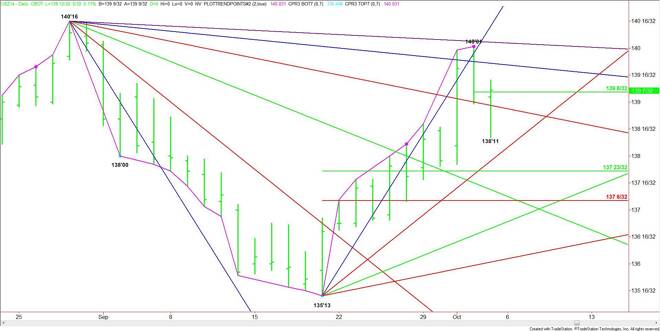
But instead of completing the break into the major downside targets, the market reversed back up after reaching 138’11. The new short-term range is 140’01 to 138’11. The pivot price created by this range is 139’06. This price is controlling the short-term direction of the market.
Holding above 139’06 could drive the T-Bonds into the first resistance angle at 139’22. This is followed by the reversal top at 140’01 and the next angle at 140’03. A trade through 140’01 will negate the bearish chart pattern. Taking this level out could generate enough upside momentum to reach the August 28 top at 140’16.
Holding below 139’06 will be the first sign of weakness, but taking out 138’28 could trigger an acceleration to the downside. The first target is Friday’s low at 138’11.
The major downside targets are a steep uptrending angle at 138’05 and the 137’23 to 137’06 retracement zone.
The tone of the market today will be decided by trader reaction to the pivot at 139’06.
About the Author
James Hyerczykauthor
James Hyerczyk is a U.S. based seasoned technical analyst and educator with over 40 years of experience in market analysis and trading, specializing in chart patterns and price movement. He is the author of two books on technical analysis and has a background in both futures and stock markets.


Advertisement