So far 2026 has been the year of Oil. Not just Oil but Energy. We saw Venezuela get a new leader via a US military extraction in the first quarter and got a Middle East War thereafter with the International Energy Agency (IEA) terming the impact of that war to be one of the most severe oil shocks in history. The Strait of Hormuz situation is really captivating when you start to think about it. That place is basically the jugular of the global economy. And on March 13th only 3 vessels traversed that corridor. The same space that usually handles about 20% of the world’s crude. The global supply was amputated. As we continue to navigate this debris, I think we must look beyond the immediate impact and see what would be the next triggers to affect the price, either up or down.

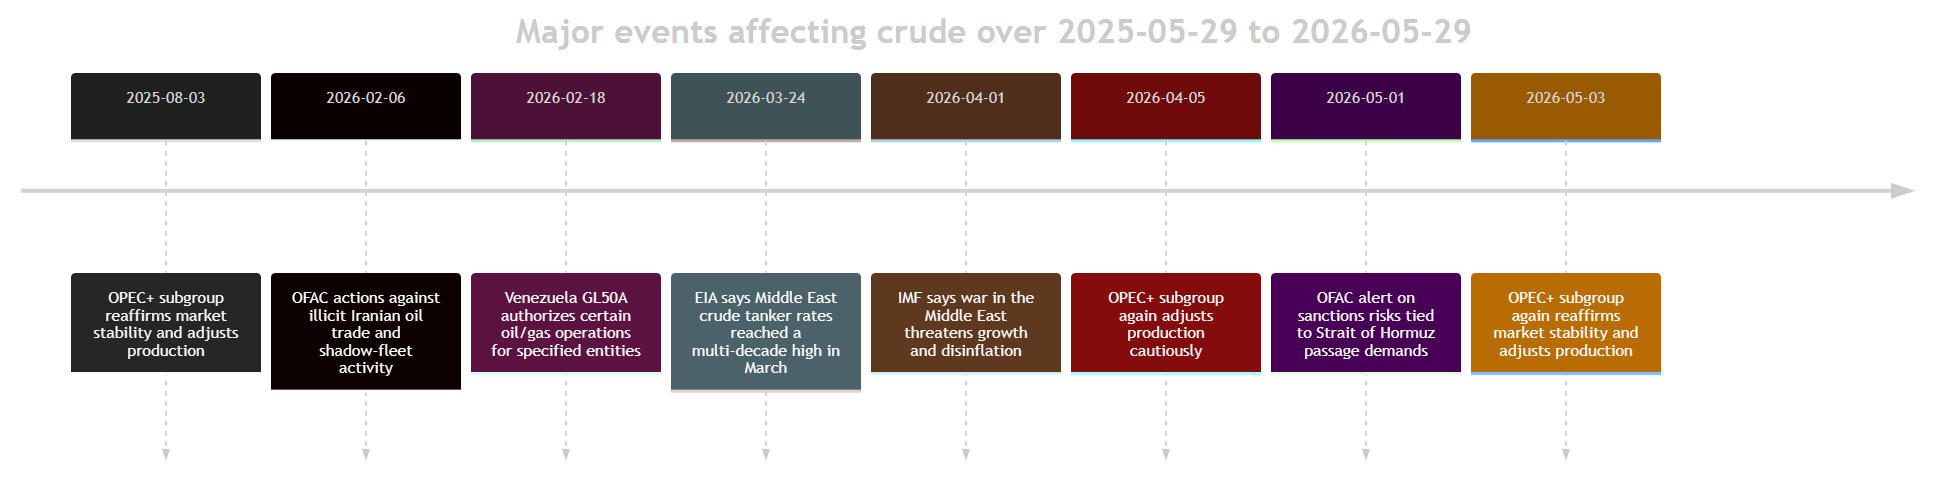
Geopolitical Supply Risks Intensify Across Key Oil Routes
Why Ships Stopped Even During the Ceasefire
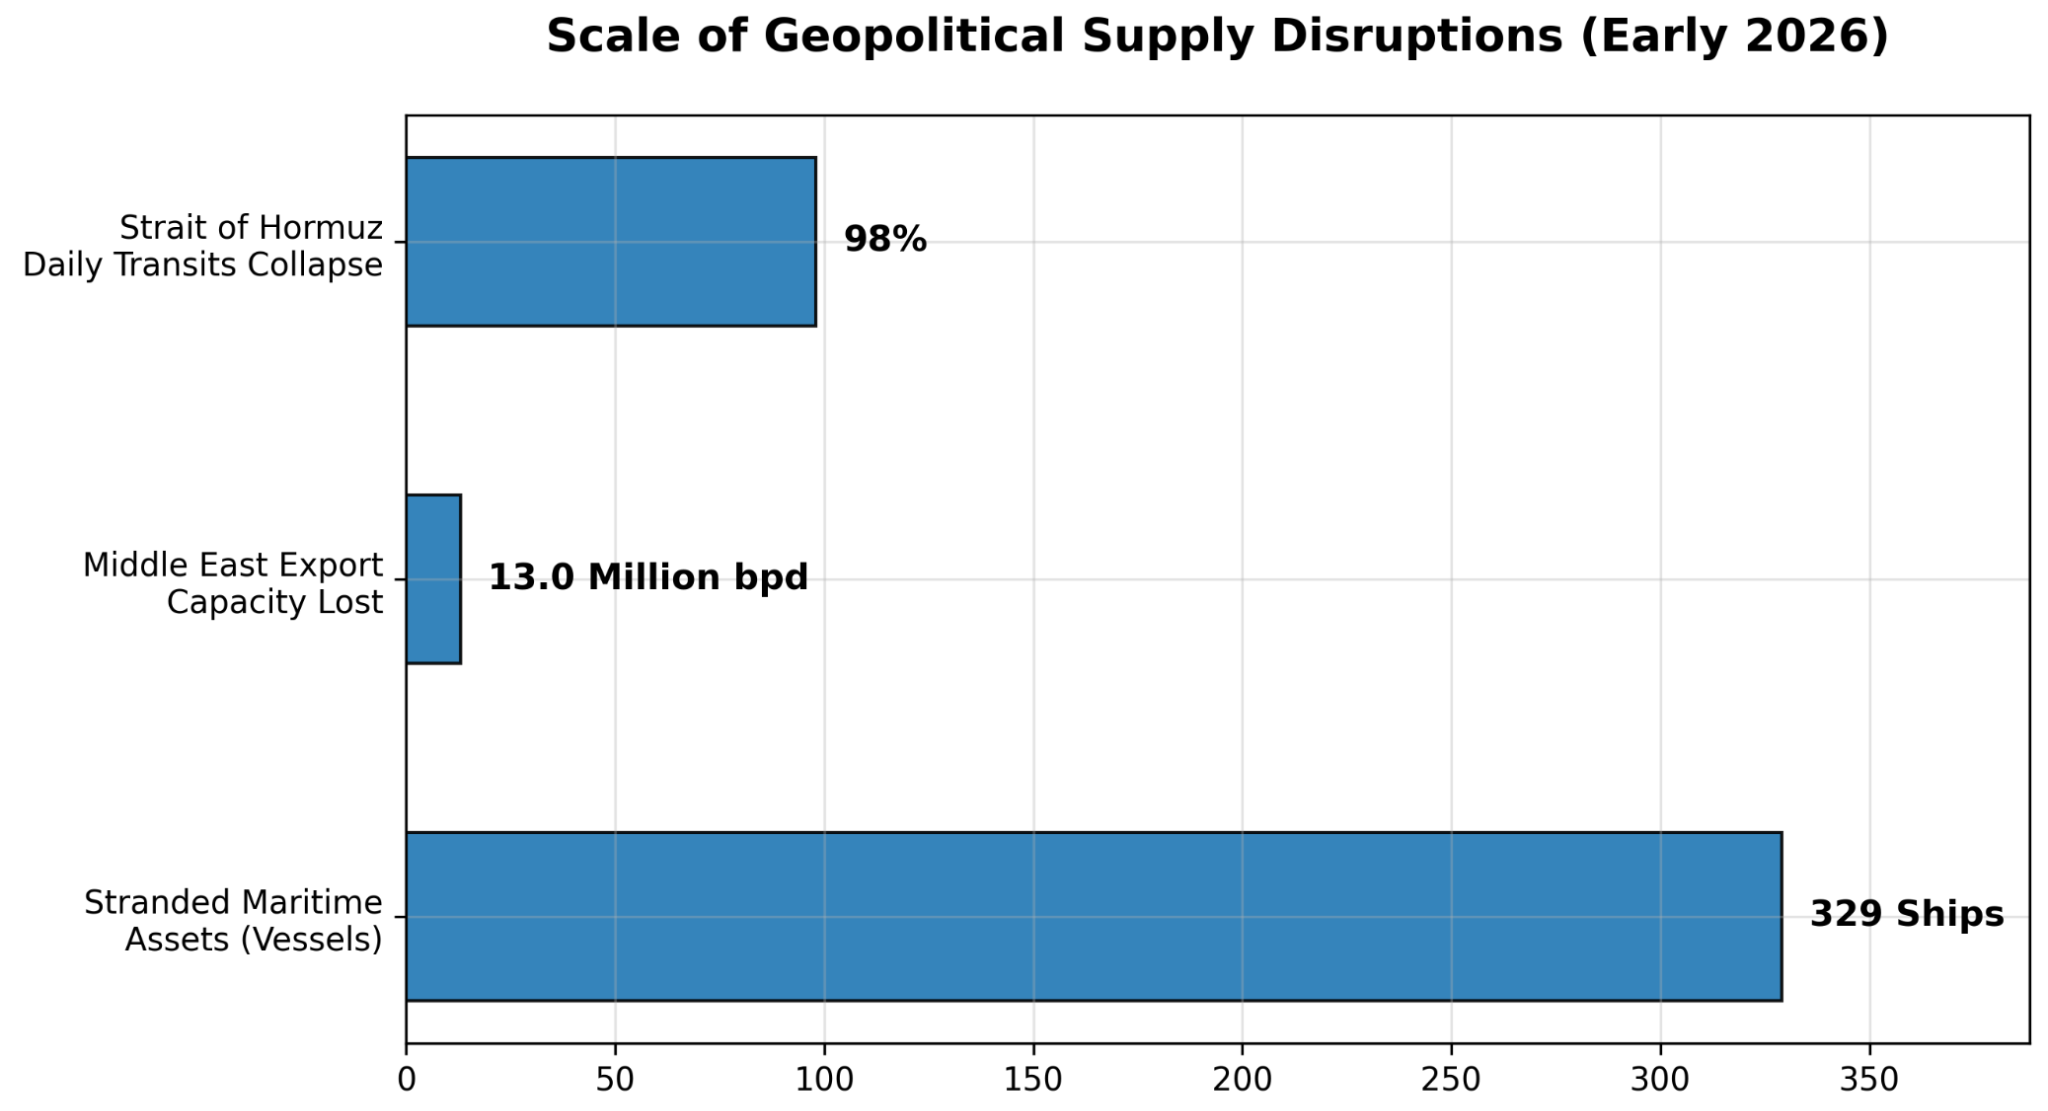
One thing that I think that people don’t get is that once a ceasefire is announced that everything is automatically going to fall back into place. Not so. The world expected that the 329 commercial vessels stranded in the Arabian Gulf to weigh anchor. But instead, $352 billion in uninsured assets remained motionless.
Indeed, underwriters, reeling from $25 billion in infrastructural damage across the region, either suspended coverage or re-priced it so aggressively that it didn’t make any financial sense to restart operations. So now, one of the things we have to see, one of the macroeconomic fundamentals, is the issuance of insurance contracts to these vessels passing through the Strait.
The US/Russia/Venezuela Sanctions Reversal
The US got pragmatic as energy prices shot up. Indeed, the drone attacks on the Russian domestic refineries that were intended to cripple Moscow’s war machine, actually provided the world with a lifeline. Russia was forced to export raw crude rather than refined products and flooded the markets. The US chose to look the other way.
Simultaneously, there was an easing of restrictions on Venezuelan heavy crude (as Maduro was no longer there), leading to the widening of the discount between WTI to Brent Crude, the largest in about 8 months. Monitoring the spread between these instruments could also give us a clearer direction to the realignment of the pricing landscape.
The UAE’s Exit From OPEC
What we also saw from this debacle was a fracture within OPEC. Abu Dhabi spent years, and billions, expanding its production capacity to 4.85 mb/d, eyeing a 5 mb/d target for 2027. Now the UAE reached a point whereby adhering to cartel quotas meant stranding its own upstream capital. So they did what they had to do. They left. We might see more of this in a port-Hormuz world. Independent volume generation will be more valuable than collective price management. The increased competition on volume could impact prices in the medium to long term.
US Running at 95% and Still Falling Behind
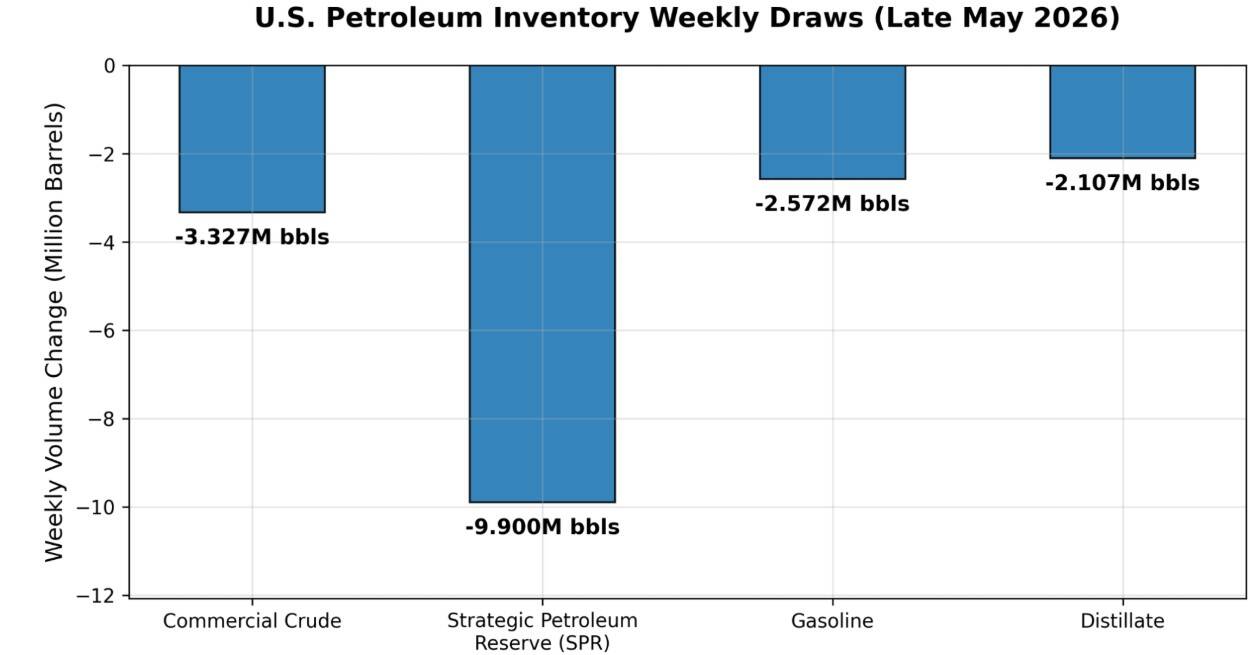
In the US, domestic refineries are at a 94.5% utilization rate but they are still falling behind a vanishing inventory curve. Crude stocks fell by 3.3 million barrels in a single week in late May, while Strategic Petroleum Reserve (SPR) draws of 9.9 million billion barrels have pushed combined domestic stocks to an 11–month low of 819.2 million barrels. So yea there’s a lagged nature of relief. While the Baker Hughes rig count jumped to 558, the largest rise in 4 years, Enverus daily GPS tracking shows a more aggressive 600+ rigs already in the field. Despite this surge, the physical barrels from these new Permian wells are months away. The inventories are not filling up on time. If this scenario continues, it is expected that WTI crude could remain elevated for some time.
Fundamentally, these triggers should eventually subside and lead to a decline in the WTI prices. Nonetheless, with the current changes in technology, I’ve been able to create a ML learning trading bot with the AB Model. After several hours communicating with Google’s Antigrativity, I was able to create AI agents that analyzed the last 6 months of 5 minute WTI Crude Oil data. Walk forward analysis was performed with an initial training window of 6 days following by a retraining step window of 2 days.
I took Renko bricks of a brick size of 0.095, making the bot predict the direction of the next brick, either up or down. I set the probability threshold to 65% with a 0.01% commission. The bot also incorporated a pyramided strategy with up to 3 positions. The features of the model are:
- Direction lag (1 to 5) => The lag number represents how many bricks ago that direction occurred relative to the currency brick
- Consecutive bricks => A running counter of how many bricks of the same direction have closed in a row.
- Bars to form => The number of raw 5-minute time bars it took to complete the current Renko brick.
- EMA_10 => 10-period EMA
- EMA_20 => 20-period EMA
- RSI_14 => 14 period RSI
- ROC_5 => 5 period ROC
- Momentum_5 => 5 period price change
- MACD => MACD technical indicator
- Upper_wick => The distance between the highest price reach during the brick’s formation
- Lower_wick => The distance between the bottom of the brick body and the lowest price reach during the brick’s formation.
In the simulated environment, here’s the performance of the last 100 signals of the bot.
| Metric | Value |
|---|---|
| Signals | 100 |
| Correct Predictions | 76 |
| Incorrect Predictions | 24 |
| Accuracy Rate | 76% |
| Cumulative Return | 5.28% |
| Maximum Drawdown | 2.18% |
AdaBoost Crude Oil Outperforms Buy and Hold Across the Last 100 Renko Signals
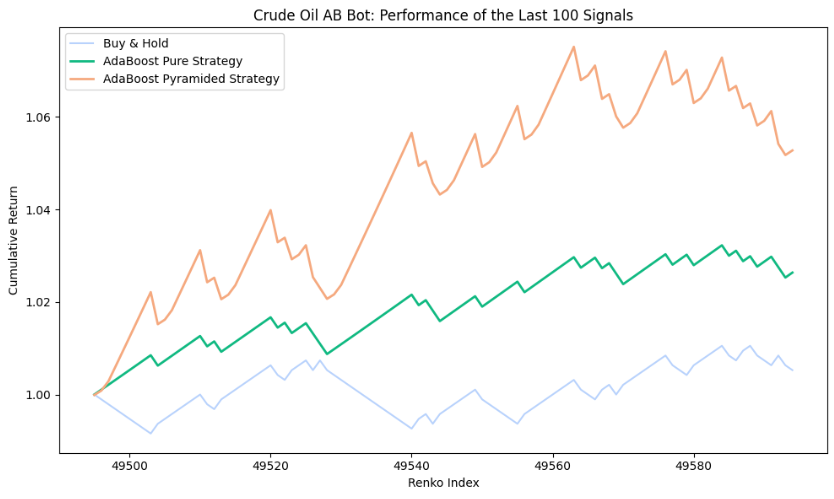
The last 100 bricks represent only 1 trading day of WTI Crude oil, highlighting the high frequency nature of the bot. So, you can use this bot to get a sense of direction when day trading. For me, I’ll let the bot make the trading decisions for me.
The Verdict
I think that Crude Oil prices would subside as the geopolitical tensions diminish. Good trackers of this would be shipping insurance as well as inventories. Nonetheless, the use of AI Agents can quickly assist you in making these trading decisions while observing the overall economics and fundamentals of the global energy industry.