
Advertisement
Advertisement
AUD/USD Forex Technical Analysis – August 10, 2015 Forecast
By:
The AUD/USD finished the week higher after posting a strong gain on Friday. The momentum into the close is likely to carry over into Monday’s opening,
The AUD/USD finished the week higher after posting a strong gain on Friday. The momentum into the close is likely to carry over into Monday’s opening, giving the market an early upside bias.
WEEKLY
The main trend is down according to the weekly swing chart. However, the momentum has shifted to the upside since the closing price reversal bottom at .7233, the week-ending July 31. Last week, this chart pattern was confirmed.
Typically, a closing price reversal retracement lasts about 2 to 3 weeks. It often retraces 50% of the last break. The weekly chart indicates there is plenty of room to the upside with the first target a downtrending angle at .7682. The next target is the 50% level at .7697.
On the downside, taking out the .7233 closing price reversal bottom will negate the chart pattern. Crossing to the weak side of a steep downtrending angle at .7202 will put the Aussie in an extremely bearish position.
Playing the long side at current levels means you are committed to a counter-trend trade which could end at any time. However, if the short-covering is strong enough to complete a normal retracement then .7697 should be your target over the next two weeks.
Supporting the notion of a strong short-covering rally is an oversold trading condition. Recent data from the Commodity Futures Trading Commissions indicates that the number of short positions in the Australian Dollar futures contract is at its highest level since late 2013.
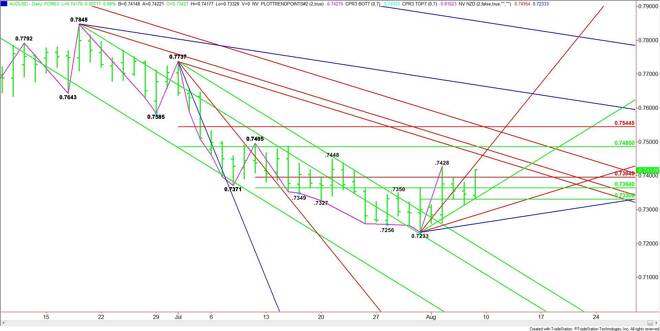
DAILY
The main trend is down according to the daily swing chart, however, the close over a key retracement zone at .7364 to .7395 indicates that momentum has shifted to the upside. These two levels are new support along with an uptrending angle at .7353.
The first upside target is a downtrending angle at .7457. The best upside target is a price cluster at .7473 to .7478.
The main range is .7737 to .7233. If the rally continues through .7478 then the next target is the 50% level of the range at .7485. This is followed by the main top at .7495. A trade through this level will turn the man trend to up.
A couple of Fed members are scheduled to speak today at 7:15 a.m. ET, 9:00 a.m. ET and 12:25 a.m. ET. Their comments could produce some volatility if they talk about the timing of the Fed rate hike.
About the Author
James Hyerczykauthor
James Hyerczyk is a U.S. based seasoned technical analyst and educator with over 40 years of experience in market analysis and trading, specializing in chart patterns and price movement. He is the author of two books on technical analysis and has a background in both futures and stock markets.


Advertisement