
Advertisement
Advertisement
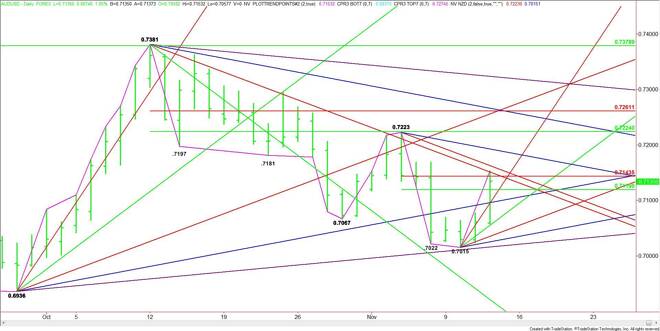
AUD/USD Forex Technical Analysis – November 12, 2015 Forecast
By:
The AUD/USD jumped early Thursday after the chances of the Reserve Bank of Australia cutting rates any time soon dwindled following stronger than expected
The AUD/USD jumped early Thursday after the chances of the Reserve Bank of Australia cutting rates any time soon dwindled following stronger than expected employment figures that put a rocket under the Australian Dollar.
The Forex pair rose 1.5 percent after the release of a report from the Australian Bureau of Statistics showed Australia’s unemployment fell to 5.9 percent in October, from 6.2 percent. The consensus forecast was for the employment rate to remain unchanged, with 15,000 jobs added. In addition, the headline number showed the economy added 58,600 jobs, soundly beating trader estimates of 14.8K.
After the release of the report, Australian Bond yields rose. Additionally, investors reduced the odds of a December rate cut from 15 percent to 5 percent. Pricing for a rate cut at the RBA’s February meeting fell to 26 percent and a rate cut at any time during 2016 dropped from 100 percent to 66 percent.
Some traders also believe that a stronger-than-expected U.S. retail sales report on Friday may even get investors to start thinking about a rate hike next year.
Technically, the main trend is down on the daily chart, however, momentum has shifted to the upside. The strong price surge has the Forex pair testing the upper end of a short-term retracement zone and a pair of key downtrending angles. Trader reaction to this area could set the tone of the market the rest of the session.
The short-term range is .7223 to .7015. Its retracement zone is .7119 to .7143. The market is currently testing the upper or Fibonacci level at .7143.
A sustained move over .7143 will indicate the presence of buyers, but any rally is likely to be labored because of downtrending resistance angles at .7151 and .7163. The latter is a trigger point for an upside breakout into the next potential resistance angle at .7193. This is followed by a swing top at .7223 and a major 50% level at .7224.
A sustained move under .7143 will signal the presence of sellers. This could create enough downside momentum to trigger a break into a 50% level at .7119. This is followed closely by a steep uptrending angle at .7095.
A longer-term uptrending angle comes in at .7096. This is followed by the angle that has provided support the last two sessions. It comes in at .7055.
Watch the price action and read the order flow at .7143 the rest of the session. This will tell us if the bulls are taking control, or if the bears are using the earlier rally as a new shorting opportunity.
About the Author
James Hyerczykauthor
James Hyerczyk is a U.S. based seasoned technical analyst and educator with over 40 years of experience in market analysis and trading, specializing in chart patterns and price movement. He is the author of two books on technical analysis and has a background in both futures and stock markets.


Advertisement